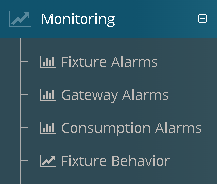
6 Monitoring
Shows different LMS process that can be monitored like gateway status.
6.1 Access map features by Role
| Functionality | SuperAdmin | Admin | Operator | Reader |
|---|---|---|---|---|
| Monitoring |  Yes Yes |
Yes |
Yes |
Yes |
| Fixture Alarms | Yes |
Yes |
Yes |
Yes |
| Gateway Alarms | Yes |
Yes |
Yes |
Yes |
| Consumption Alarms | Yes |
Yes |
Yes |
Yes |
| Fixture Behavior | Yes |
Yes |
Yes |
Yes |
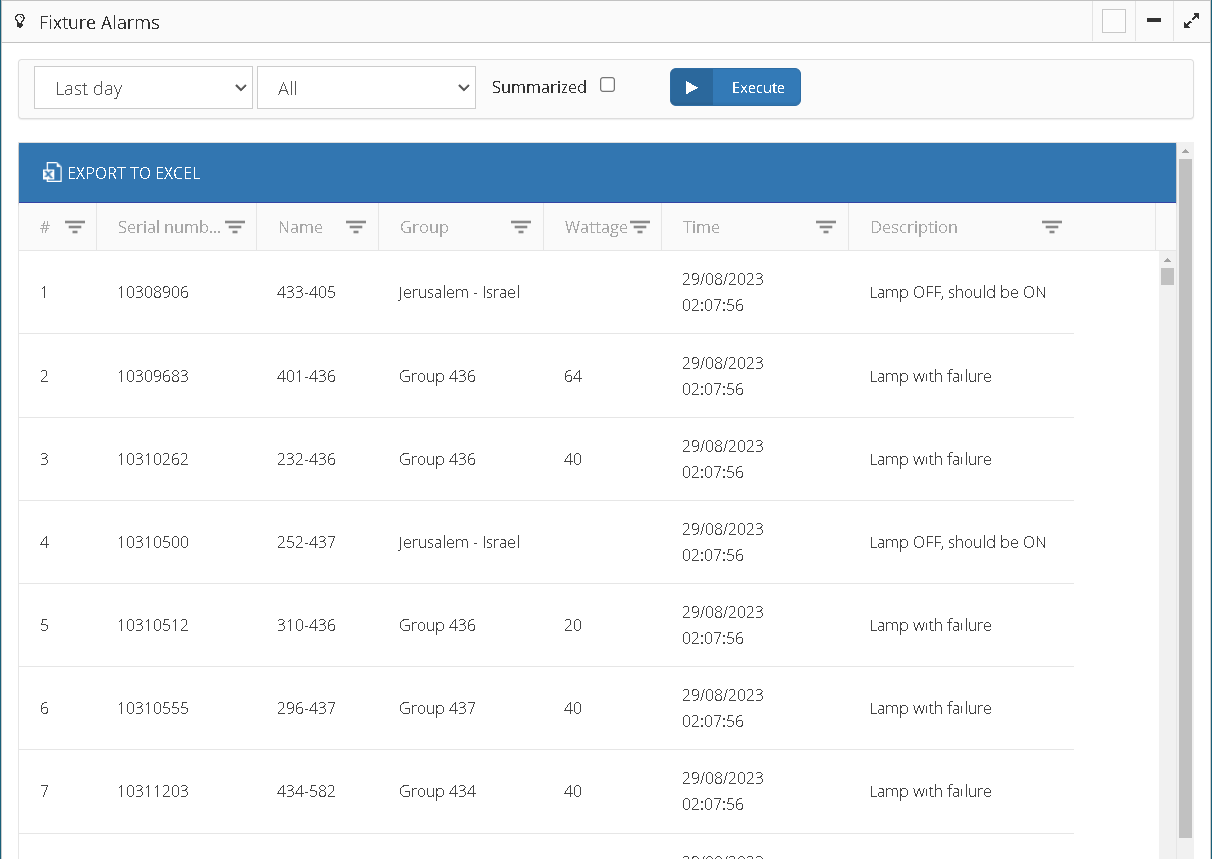
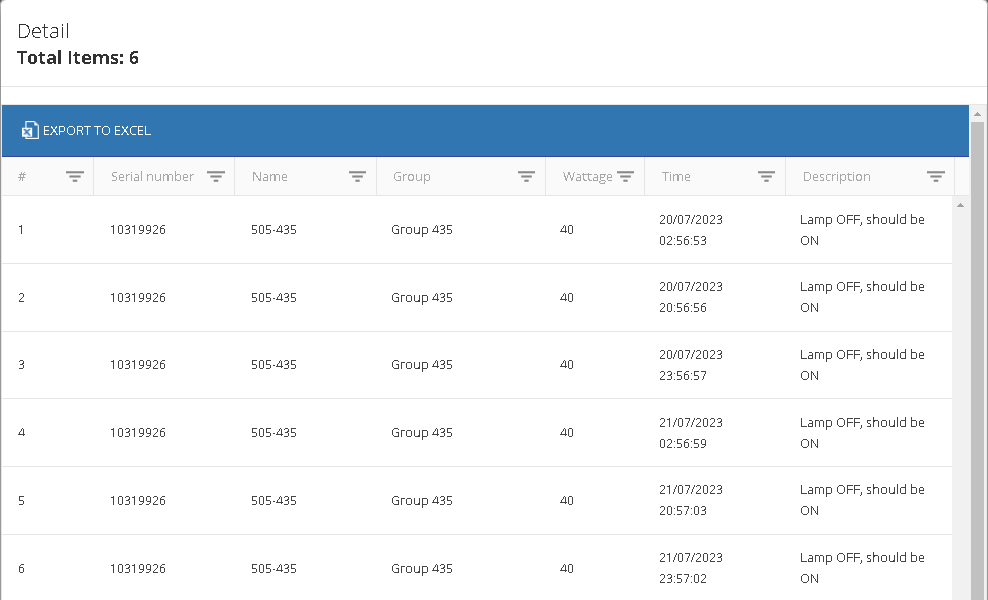
6.2 Fixture Alarms
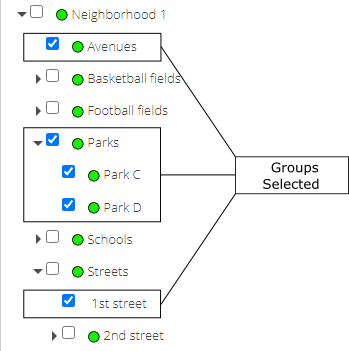
The fixture alarms report shows information about fixtures with failure or bad behavior of a selected group or groups.
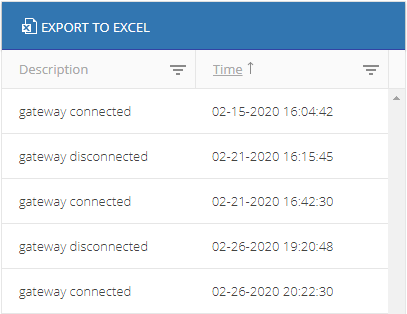
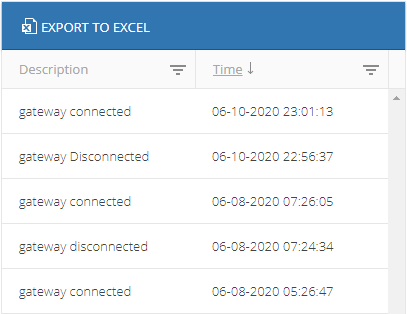
6.2.1 Sorting data
The report data can be sorted by clicking the name of a column.
The data contained in the report can be sorted as follows:
- Ascending, from A to Z (letters) or lower to higher (numbers).
- Descending, from Z to A (letters) or higher to lower (numbers).
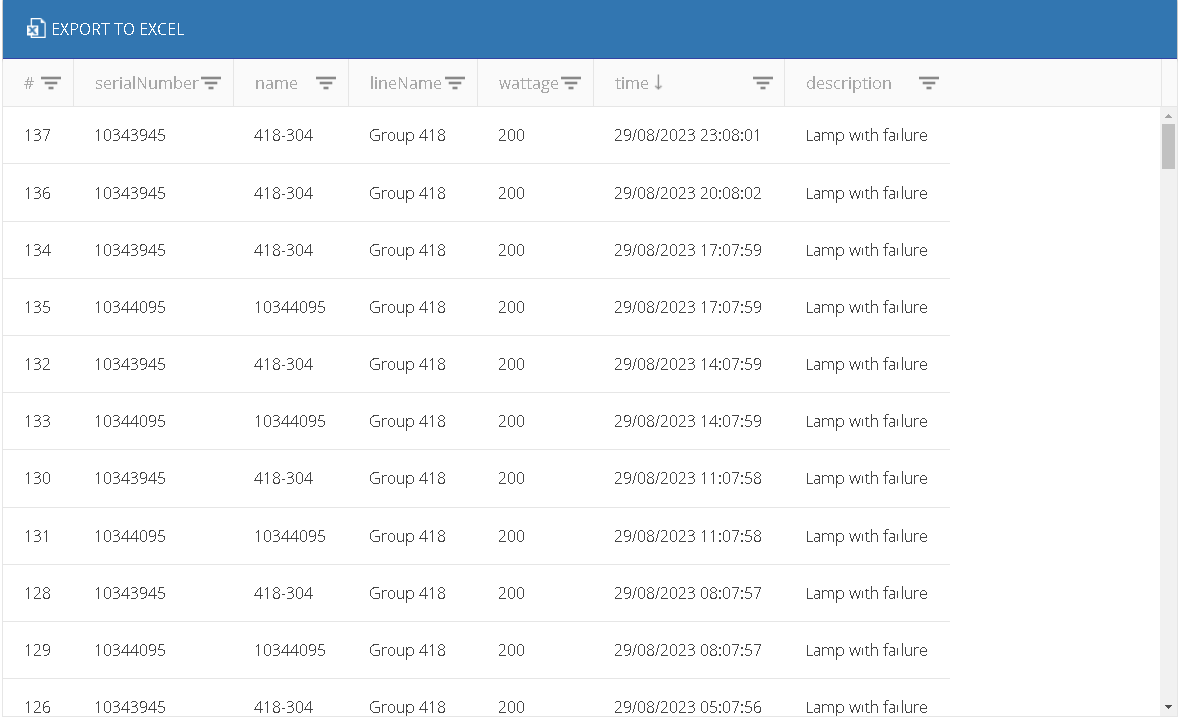
- Default, restores the original order of the generated report.
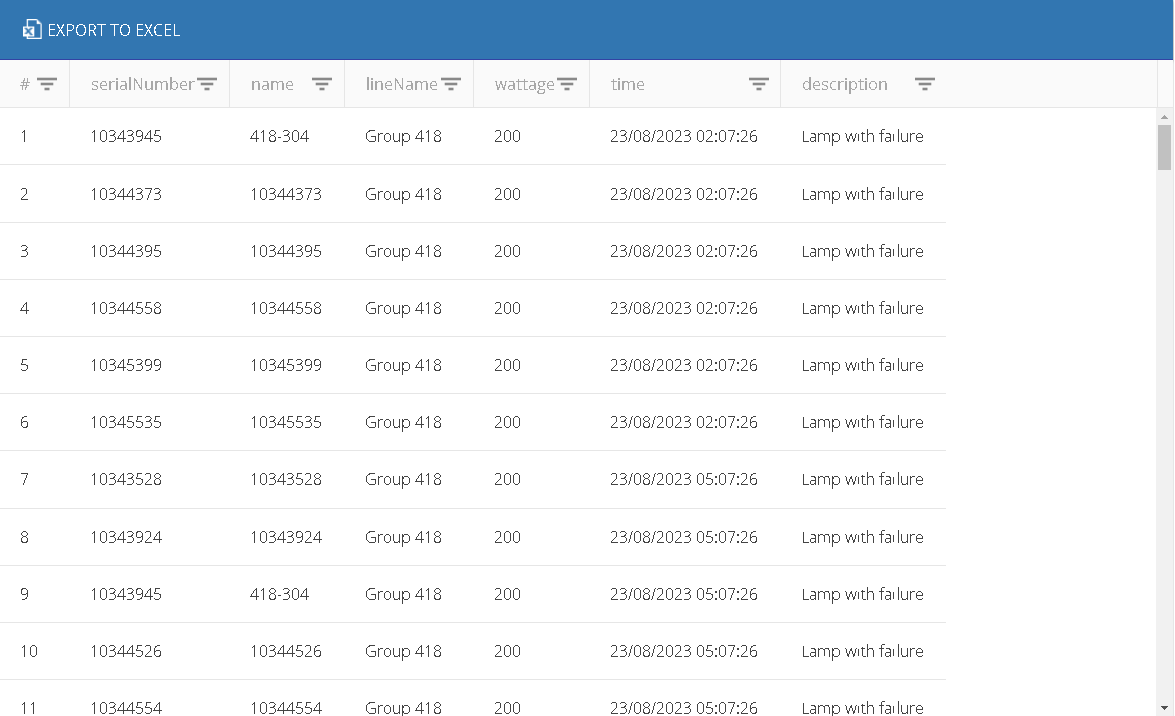
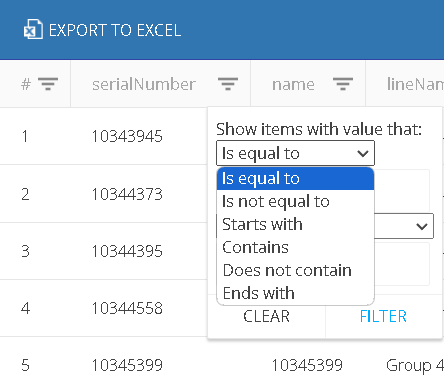
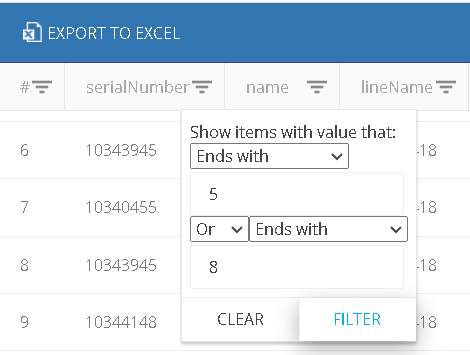
6.2.2 Data filtering
To perform the data filtering, click on the icon next to the name of the column.
The data contained in the report can be filtered as follows:
- Is equal to
- Is not equal to
- Starts with
- Contains
- Does not contain
- Ends with
Up to 2 types of data filtering can be defined per column, with the following logical operators:
- And
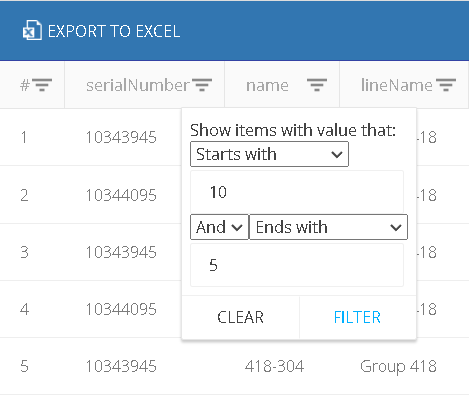
- Or
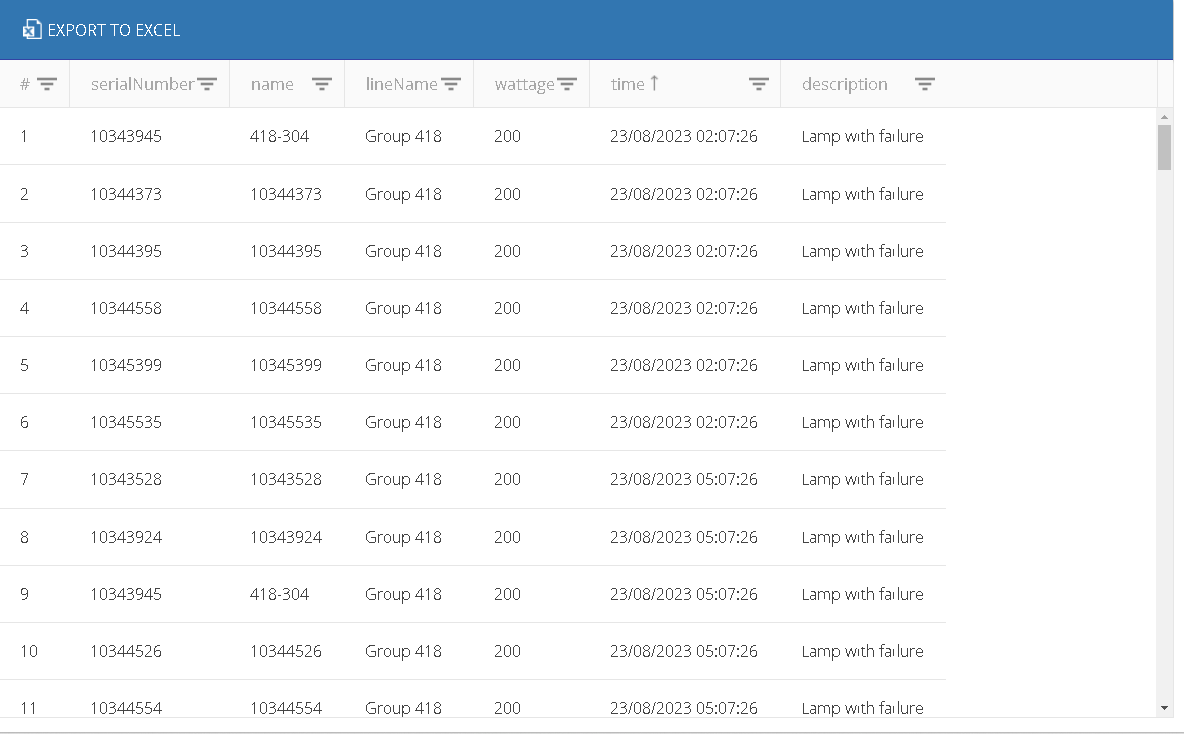
6.2.3 Export to Excel
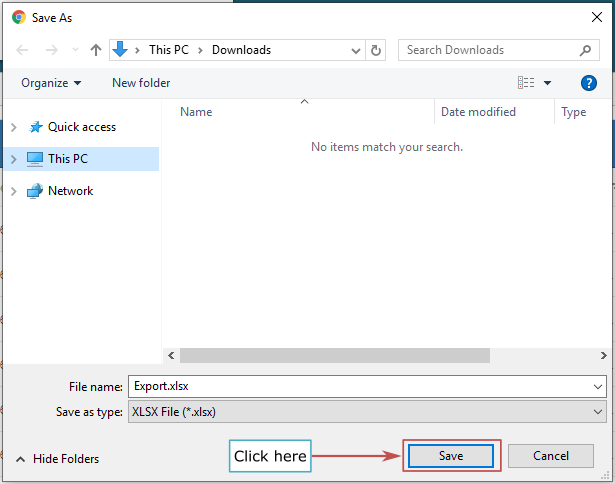
The report can be exported to Excel, and then downloaded to the local machine.
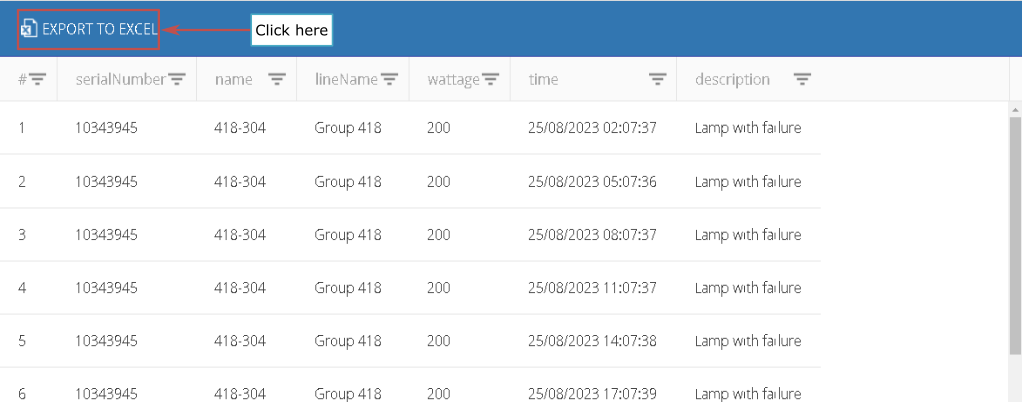
The pop-up window allows to define the name and location of the generated file.
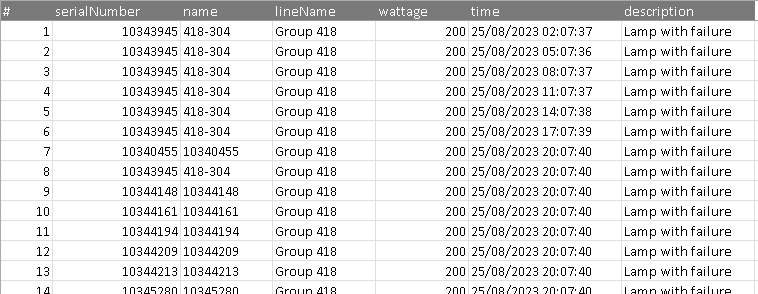
Below is an example of the contents of the exported file.
6.2.4 Report filters
Below is the list of predefined date filters:
Last day
Last week
Last month
Three months back
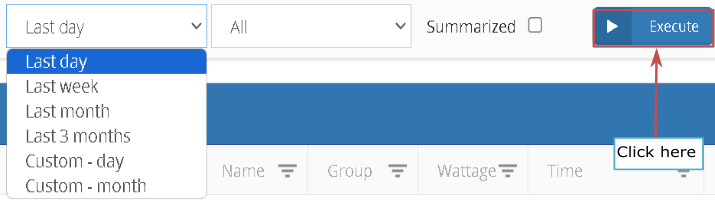
- Custom per day filter.

- Custom per month filter.

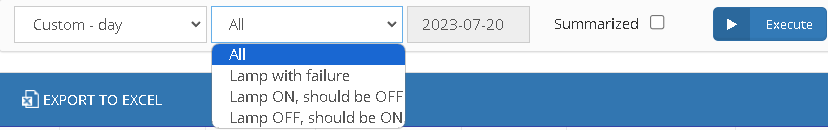
Below is the list of types of failure filters:
All
Lamp with failure
Lamp ON, should be OFF
Lamp OFF, should be ON
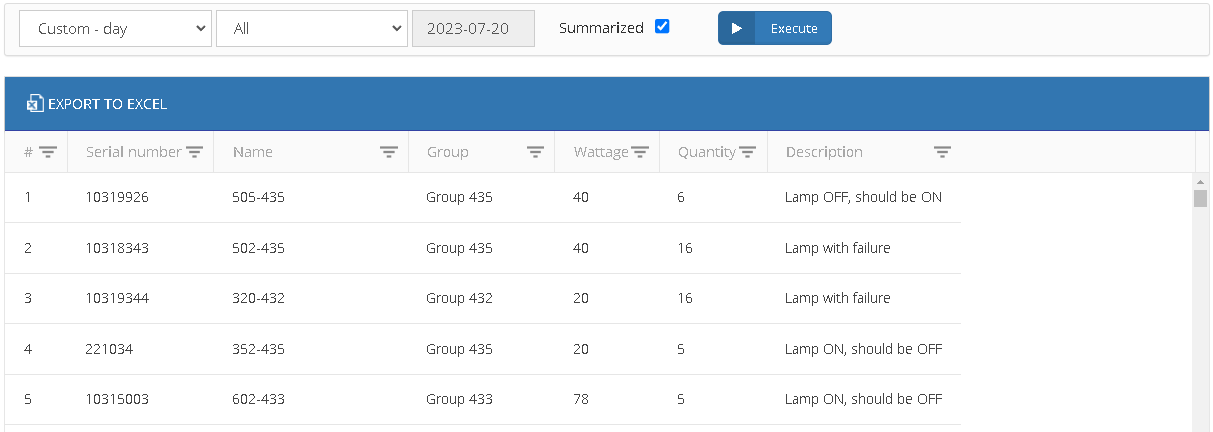
- Summarized: If this option is checked the report will show a resume of failures by fixture.
- Click on fixture row to se the detail of failtures. 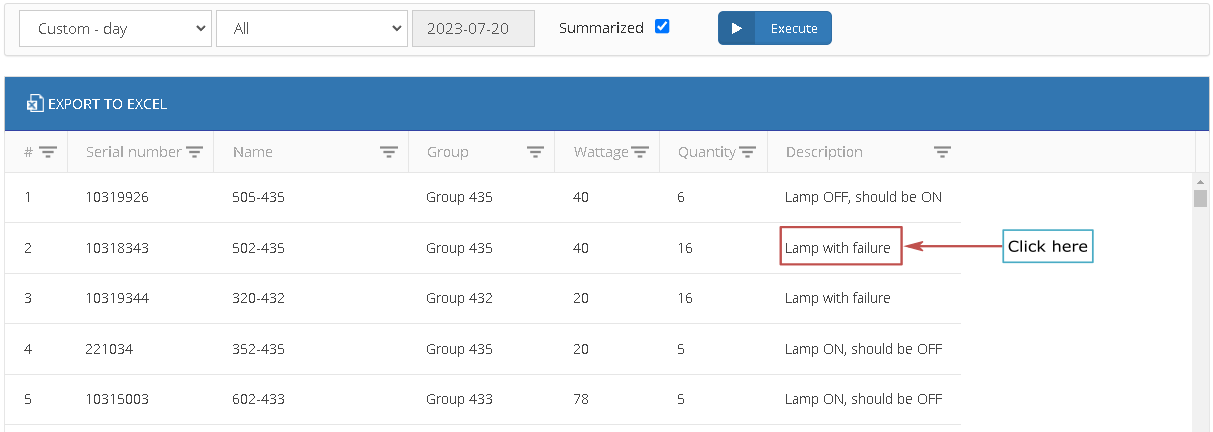
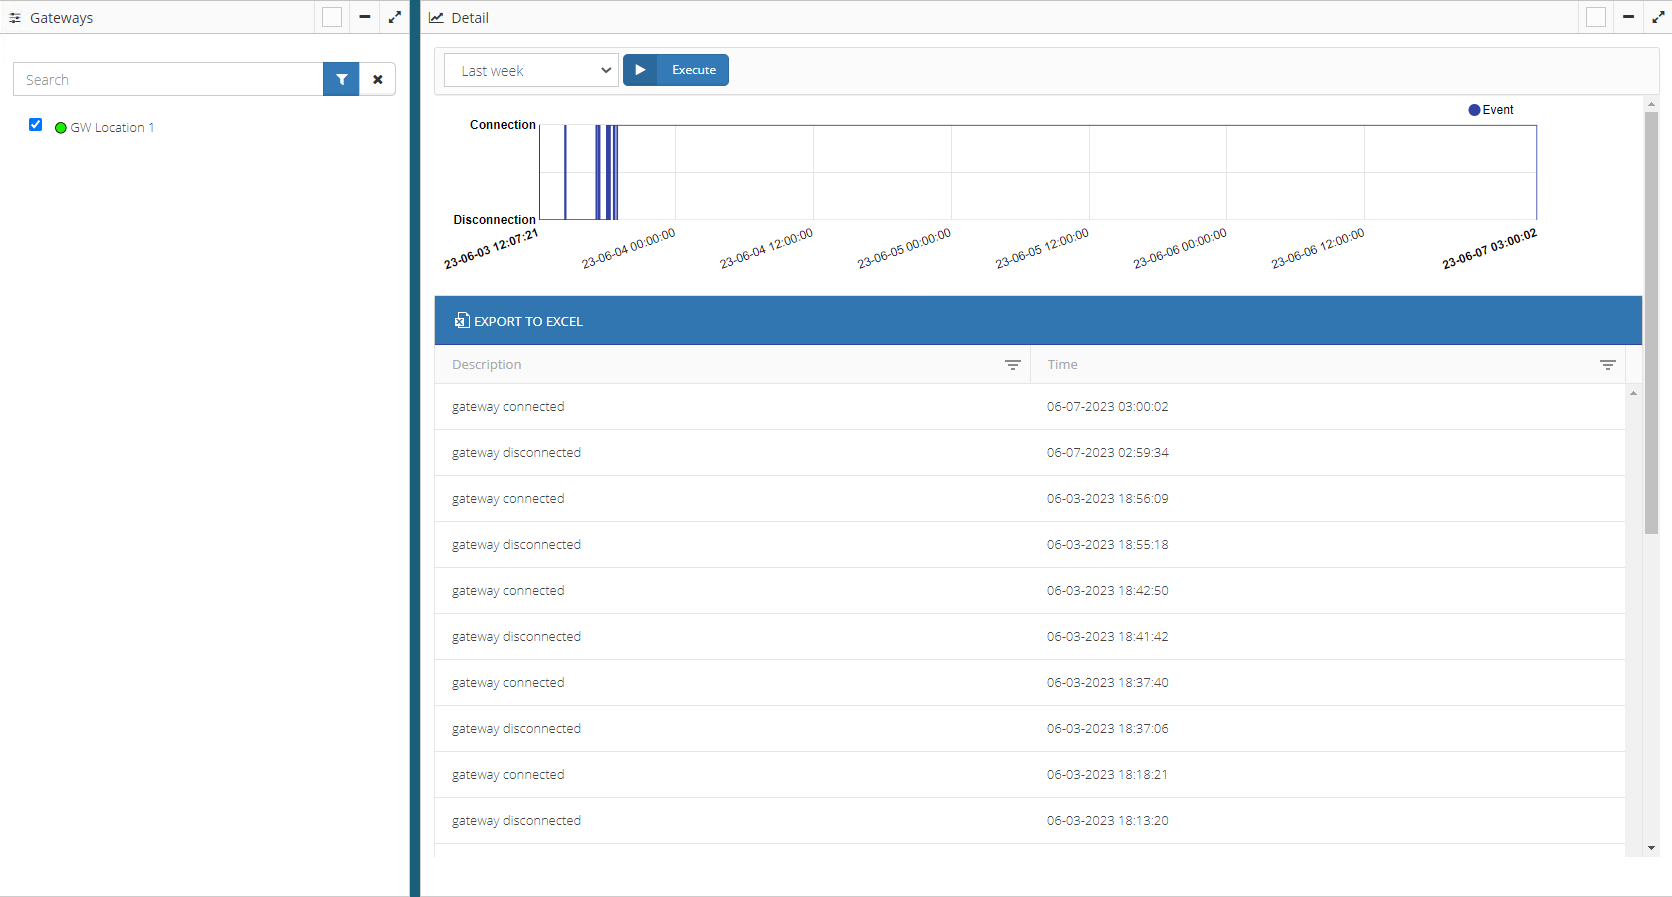
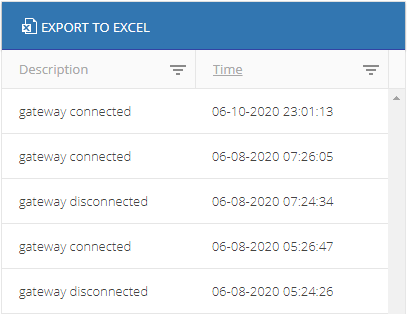
6.3 Gateway Alarms
The gateway alarms report shows the connection and disconnection history of a selected Gateway.
6.3.1 Sorting data
The report data can be sorted by clicking the name of a column.
The data contained in the report can be sorted as follows:
- Ascending, from A to Z (letters) or lower to higher (numbers).
- Descending, from Z to A (letters) or higher to lower (numbers).
- Default, restores the original order of the generated report.
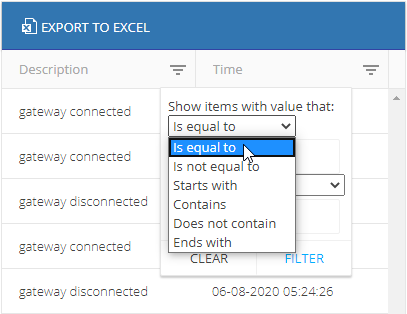
6.3.2 Data filtering
To perform the data filtering, click on the icon next to the name of the column.
The data contained in the report can be filtered as follows:
- Is equal to
- Is not equal to
- Starts with
- Contains
- Does not contain
- Ends with
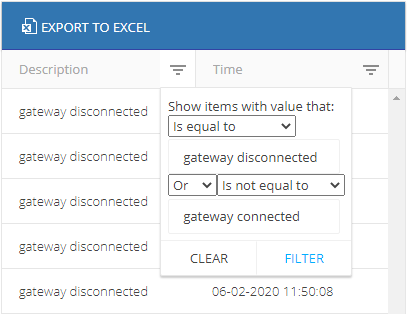
Up to 2 types of data filtering can be defined per column, with the following logical operators:
- And
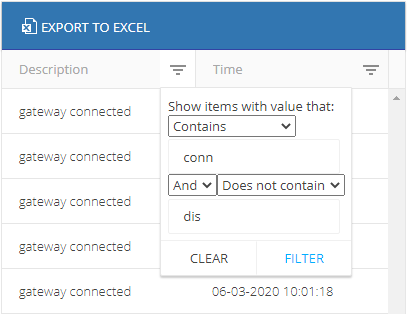
- Or
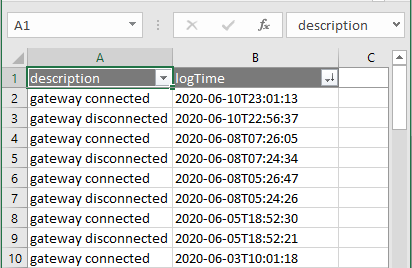
6.3.3 Export to Excel
The report can be exported to Excel, and then downloaded to the local machine.
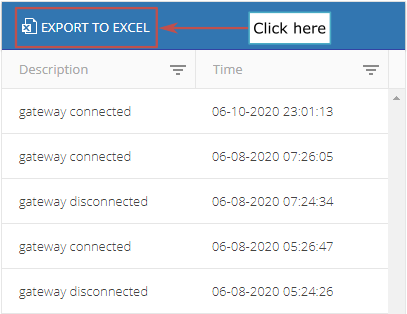
The pop-up window allows to define the name and location of the generated file.

Below is an example of the contents of the exported file.
6.3.4 Chart filtering by Dates
Below is the list of predefined filters:
Last day
Last week
Last month
Three months back
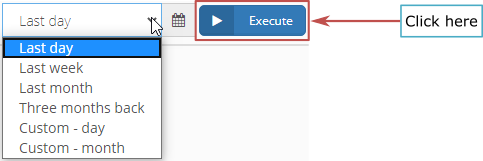
- Custom per day filter, specifying a specific day.

- Custom per month filter, specifying a specific month.

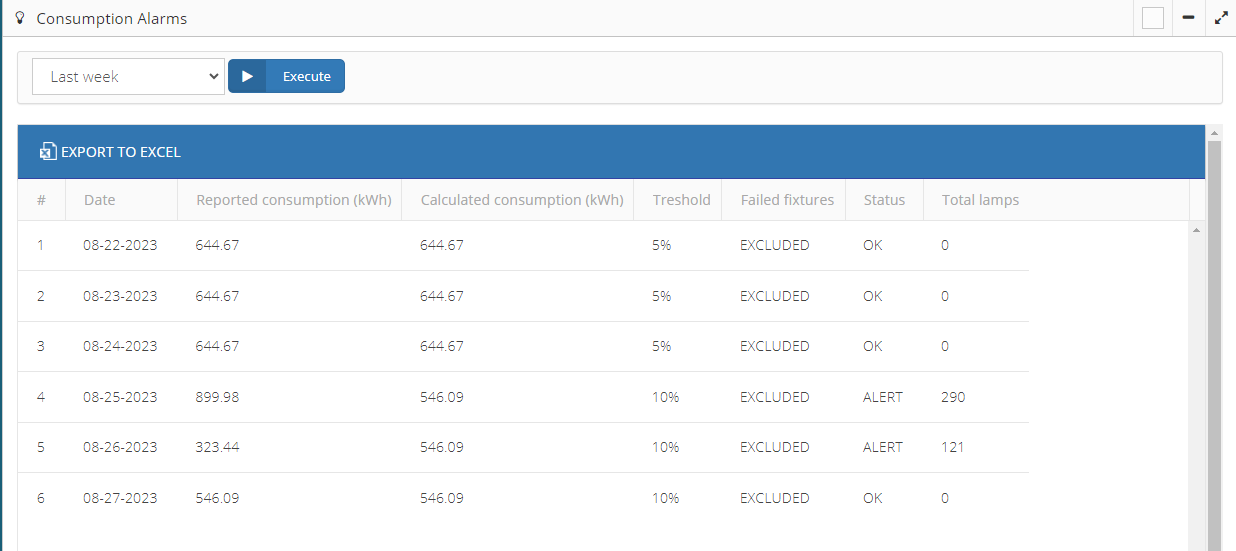
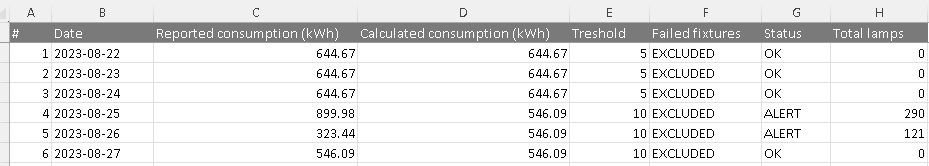
6.4 Consumption Alarms
The report shows information about consumption in KWH of a selected group or groups.
6.4.1 Sorting data
The report data can be sorted by clicking the name of a column.
The data contained in the report can be sorted as follows:
- Ascending, from A to Z (letters) or lower to higher (numbers).
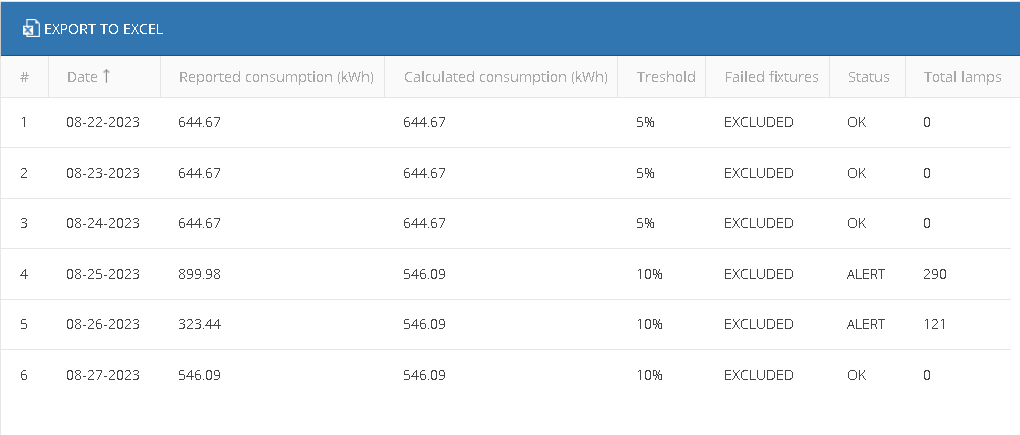
- Descending, from Z to A (letters) or higher to lower (numbers).
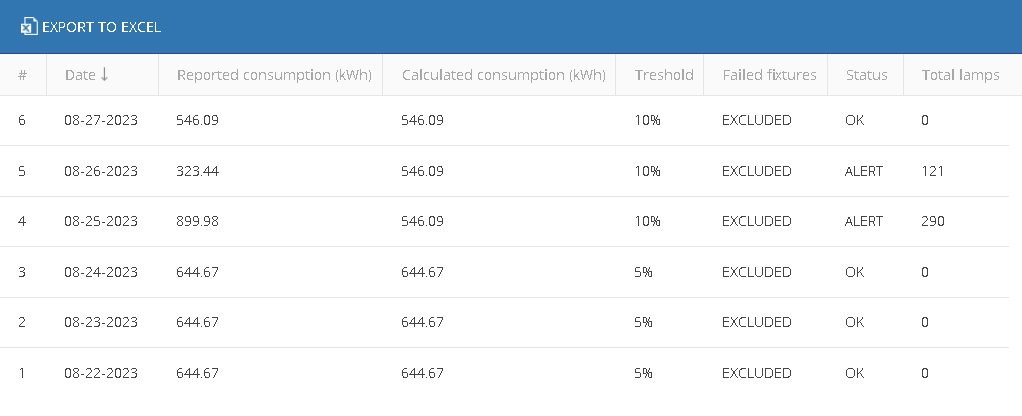
- Default, restores the original order of the generated report.
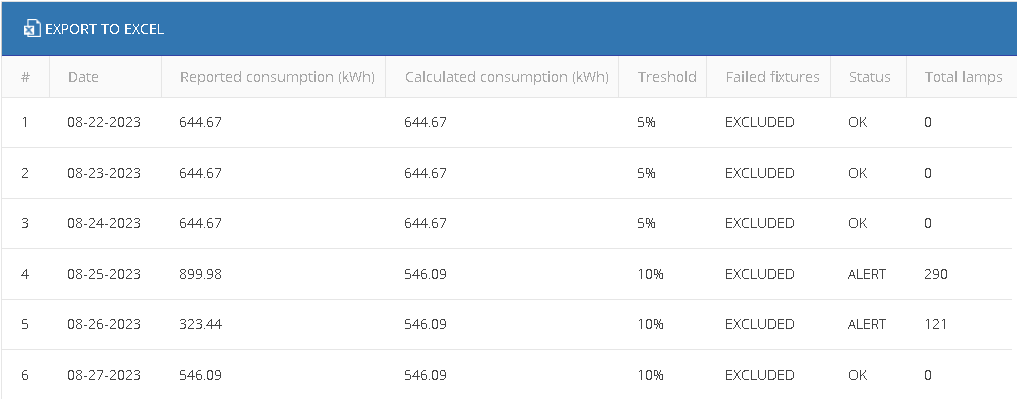
6.4.2 Export to Excel
The report can be exported to Excel, and then downloaded to the local machine.
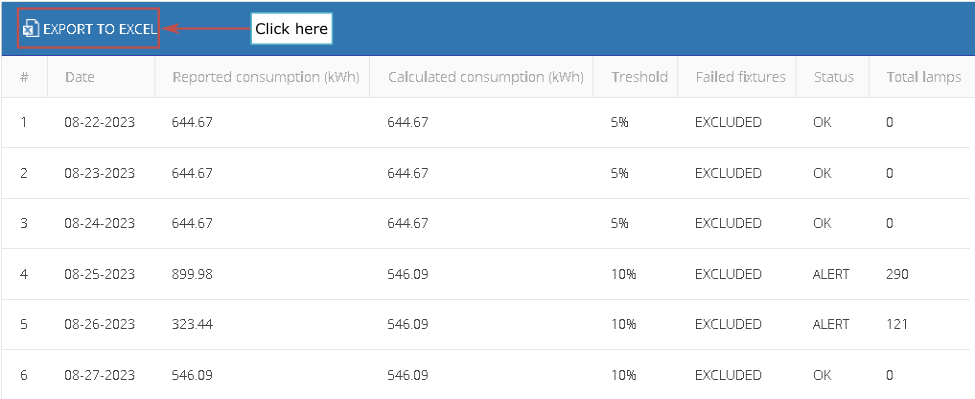
The pop-up window allows to define the name and location of the generated file.
Below is an example of the contents of the exported file.
6.4.3 Report filters
Below is the list of predefined filters:
Last day
Last week
Last month
Three months back
- Custom per day filter, specifying a specific day.
- Custom per month filter, specifying a specific month.
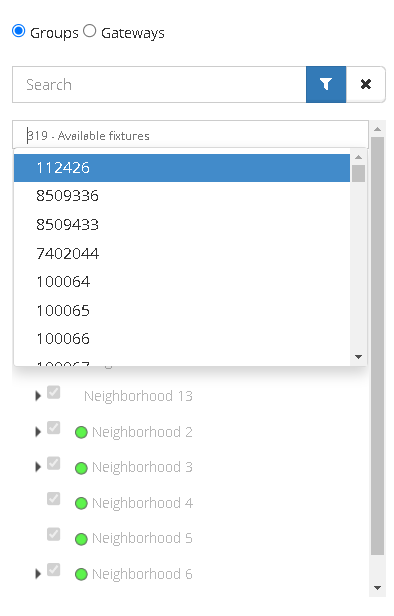
6.5 Fixture Behavior
The chart report shows the behavior of specific fixture. That can be selected of a groups or gateways.
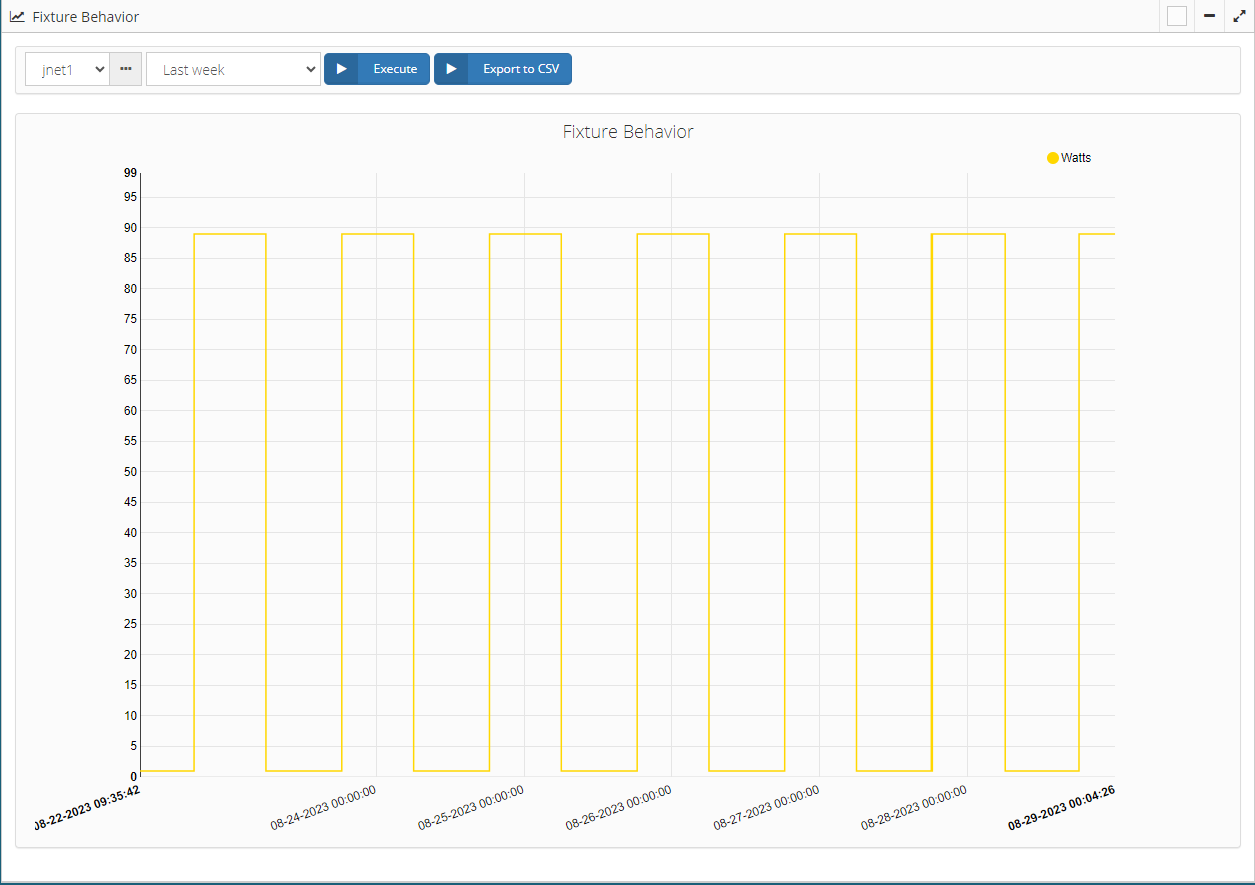
6.5.1 Chart filtering by Dates
Below is the list of predefined filters:
Last day
Last week
Last month
Three months back
- Custom per day filter, specifying a specific day.
- Custom per month filter, specifying a specific month.