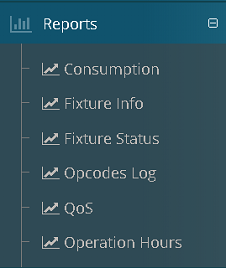
5 Reports
Displays related information to the site through graphs and reports generated from the settings defined in the lighting control system.
5.1 Access map features by Role
| Functionality | SuperAdmin | Admin | Operator | Reader |
|---|---|---|---|---|
| Reports |  Yes Yes |
Yes |
Yes |
Yes |
| Consumption | Yes |
Yes |
Yes |
Yes |
| Fixtures Info | Yes |
Yes |
Yes |
Yes |
| Fixtures Status | Yes |
Yes |
Yes |
Yes |
| Opcodes Log | Yes |
Yes |
Yes |
Yes |
| Quality of service (QoS) | Yes |
Yes |
Yes |
Yes |
| Operation Hours | Yes |
Yes |
Yes |
Yes |
5.2 Consumption
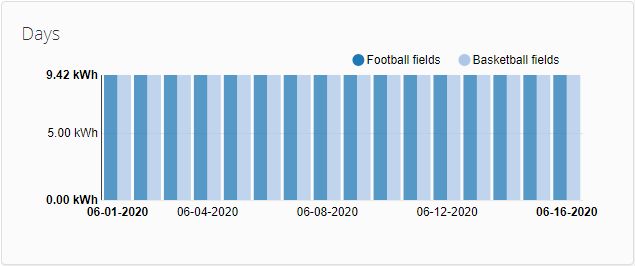
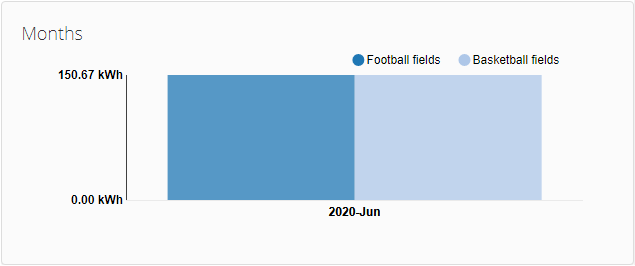
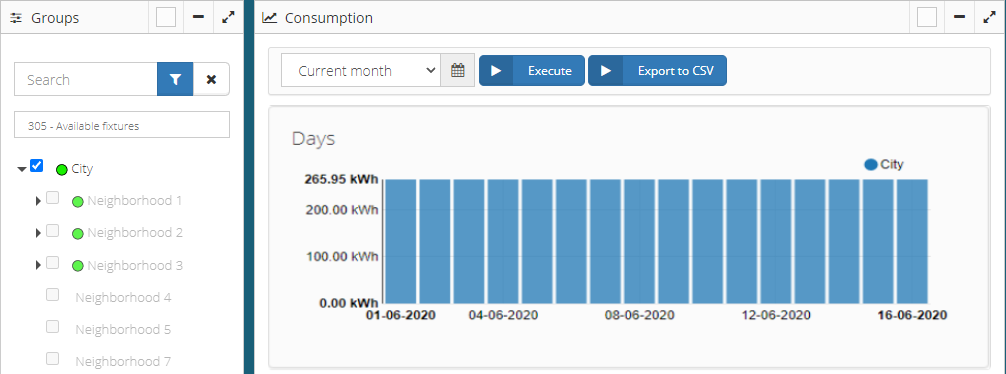
Displays the report of consumption in kWh of the fixtures that belongs to the group or groups selected.
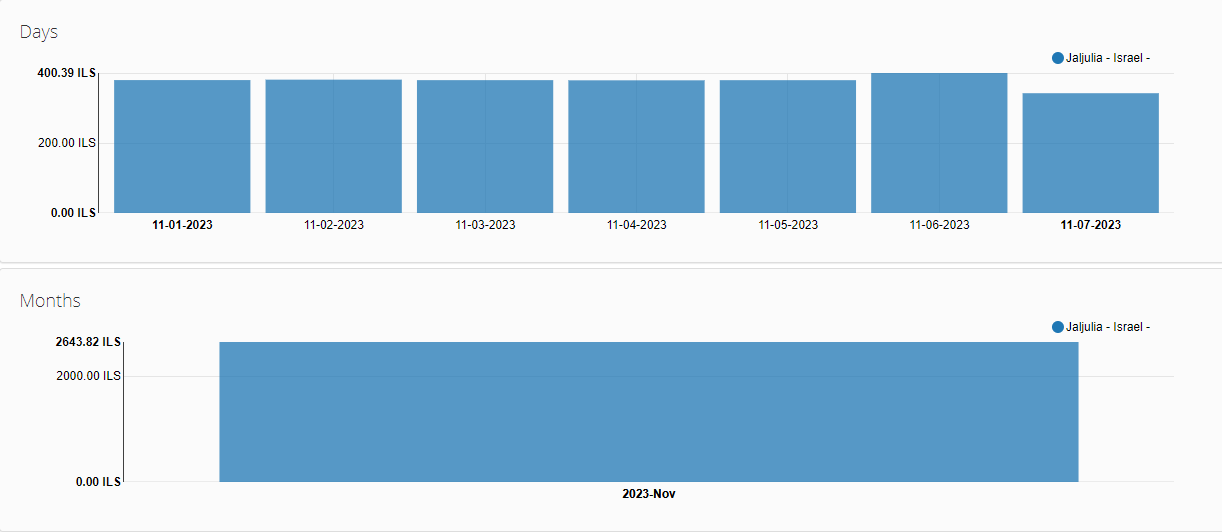
The chart can be displayed, according to the selection of Group or Groups:
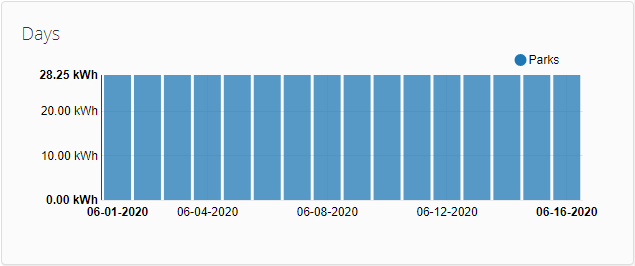
- By days, it refers to consumption in kWh per day, in the current month.
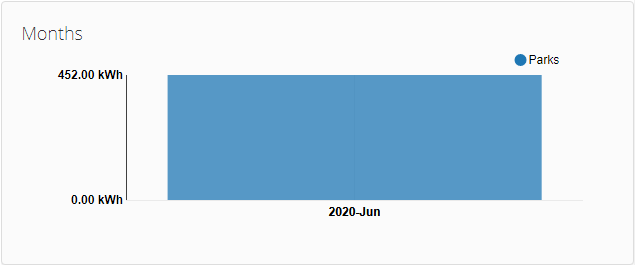
- By months, it refers to the consumption in kWh accumulated of the current month.

NOTE:
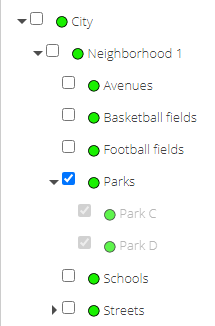
- When selecting a Group that has subgroups, will display the information of consumption in kWh of the Group selected with it’s subgroups.
- Example of visualization of charts by days and by months - selected group with subgroups.
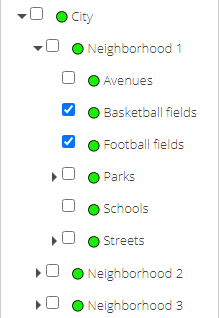
- Example of visualization of charts by days and by months - selected two groups.
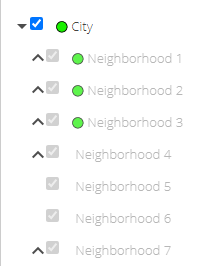
5.2.1 Chart filtering by Groups
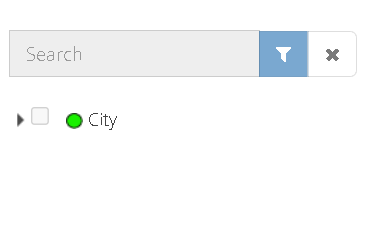
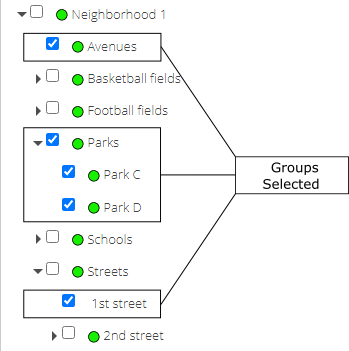
- Filter by Group, allows to select a Group or Groups in the left panel.
5.2.2 Chart filtering by Dates
Allows filtering according the list below:
- Current month
- Last month
- Two months back
- Three months back
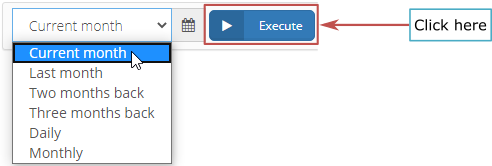
- Daily Filtering, when performing a filter by date range

- Monthly filtering, when performing a filter by month range

5.2.3 Export to CSV
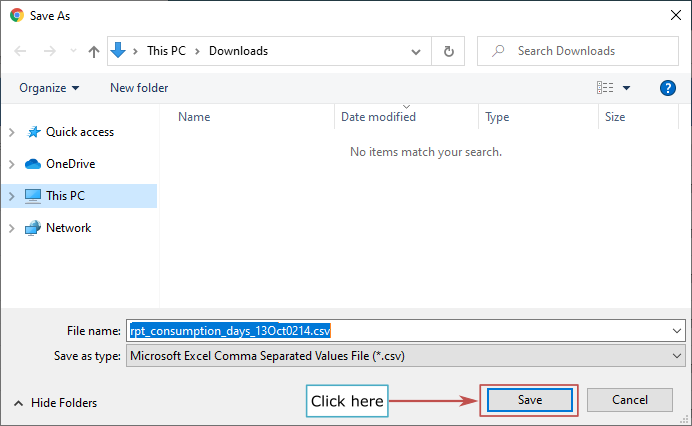
The values of the graphics can be exported to CSV files (Comma Separated Values), and then downloaded to the local machine.

The pop-up window allows to define the name and location of the generated file.
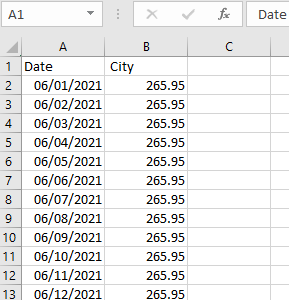
Below is an example of the contents of the exported file:
- Example of a CSV file exported by days
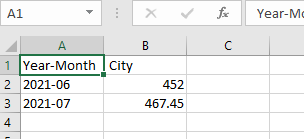
- Example of a CSV file exported by months
5.2.4 Consumption Cost
If consumption cost is enable on configuration in functionality section, a radio button will show that allow to switch between Kwh and cost according to the currency configurated. See Consumption cost configuration

Below is an example of the graphics with currency selected:
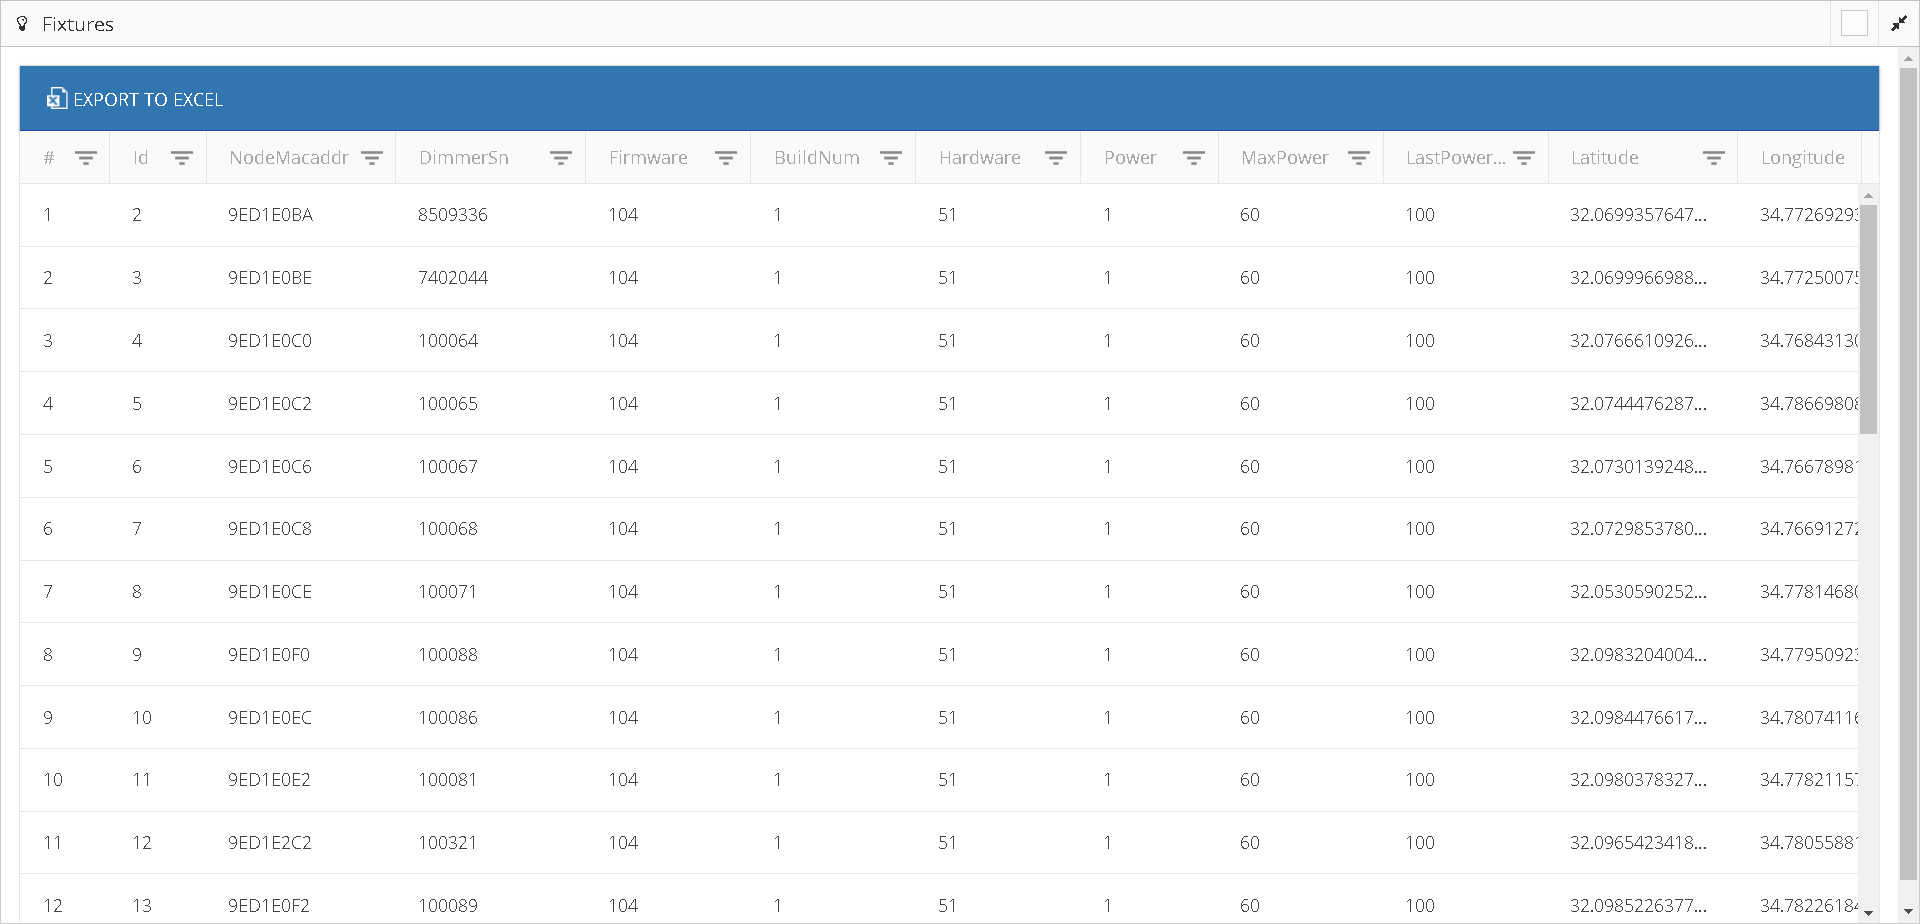
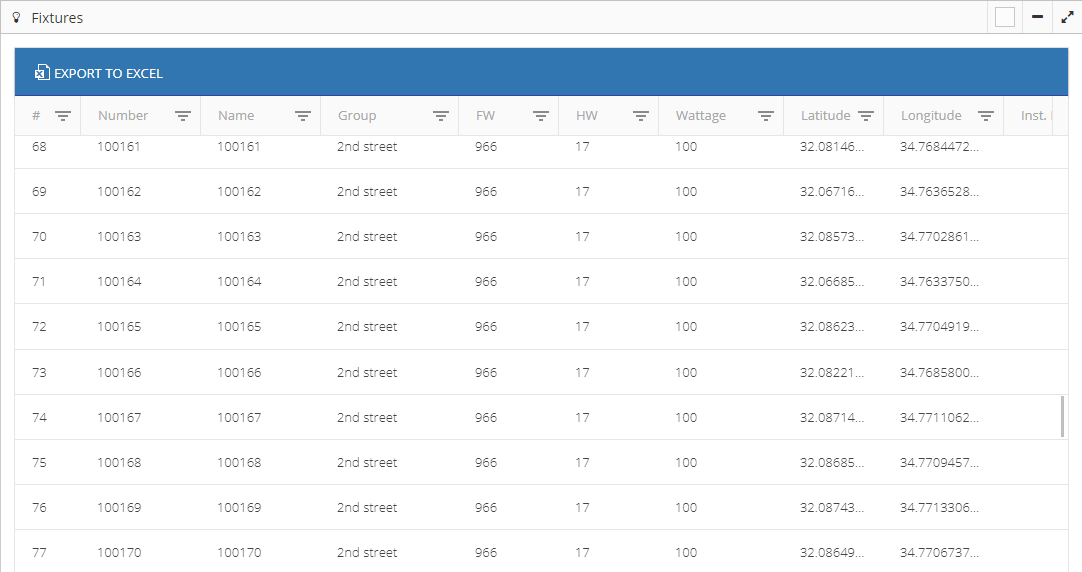
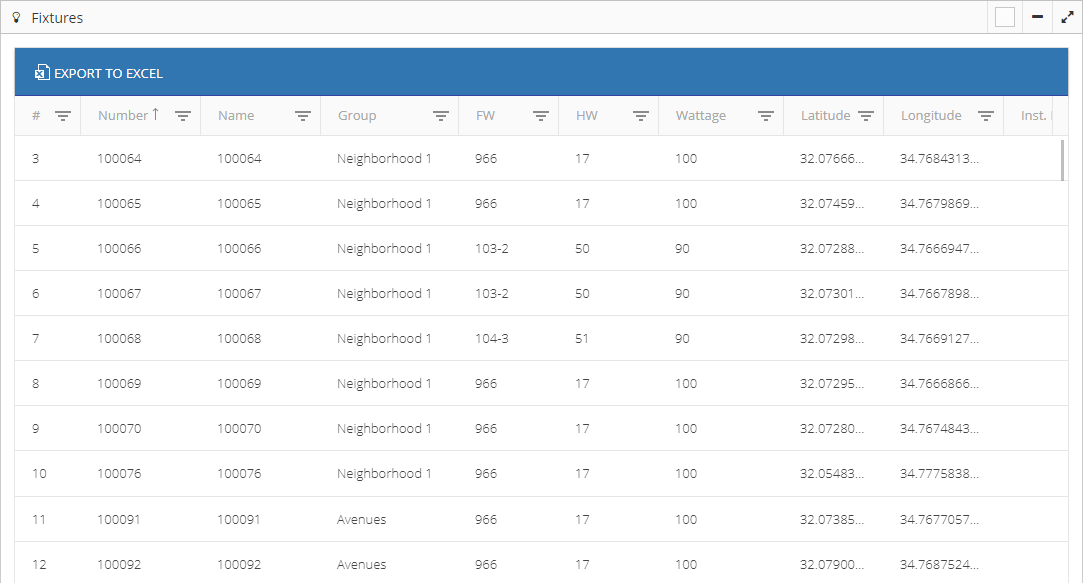
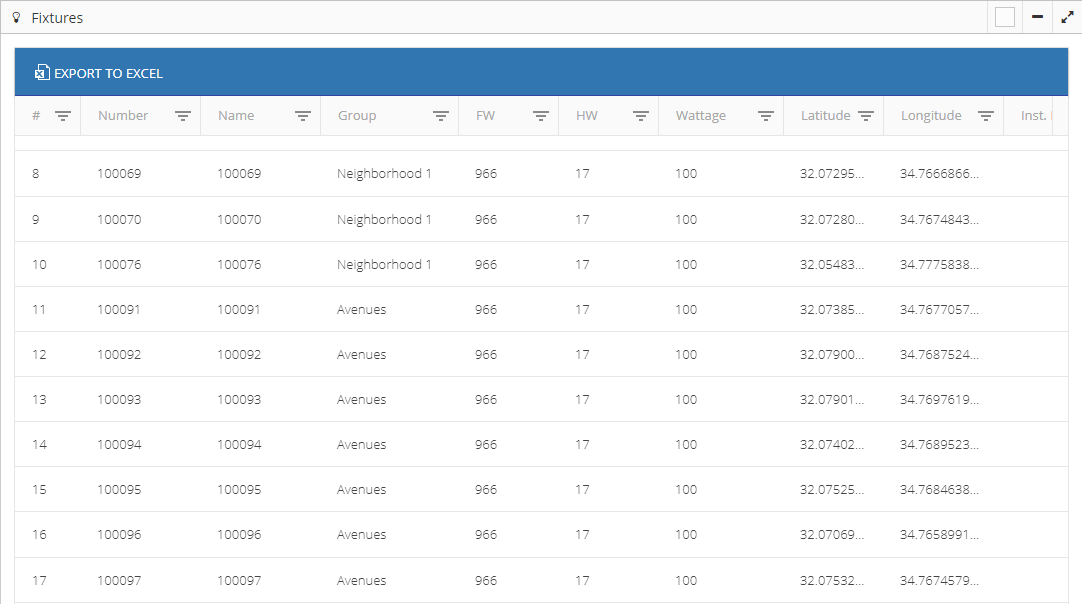
5.3 Fixture Info
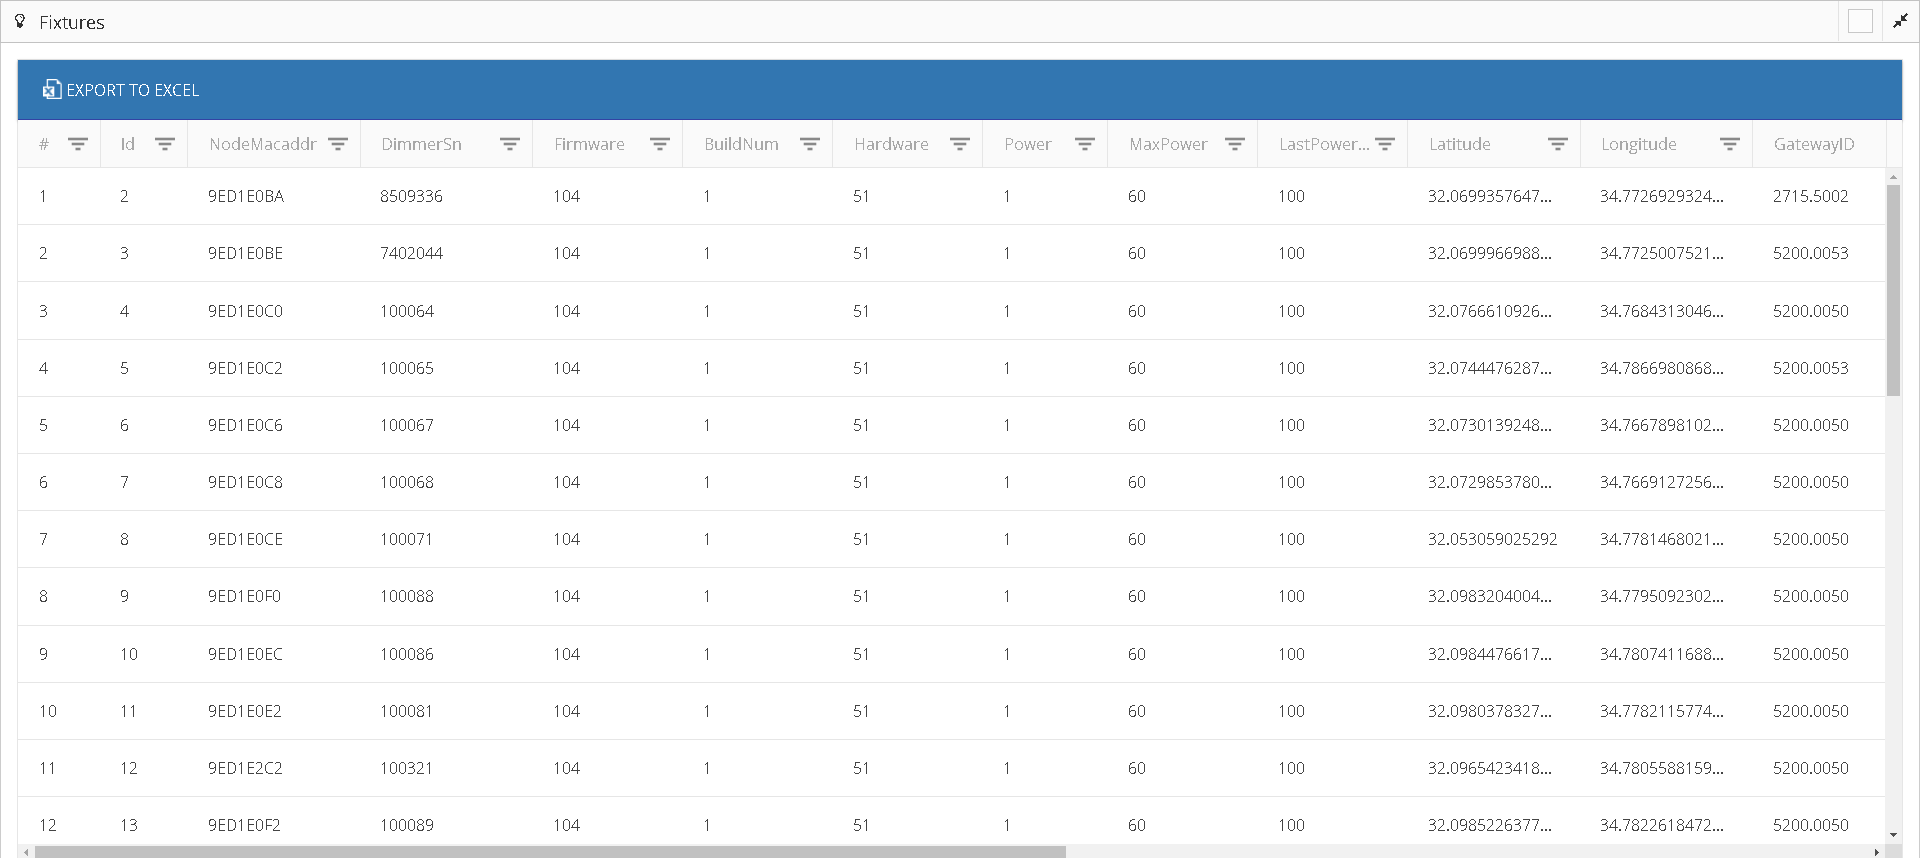
The report shows all the information of the fixtures on LMS system. Selected groups is disabled because all fixtures are listed on report.
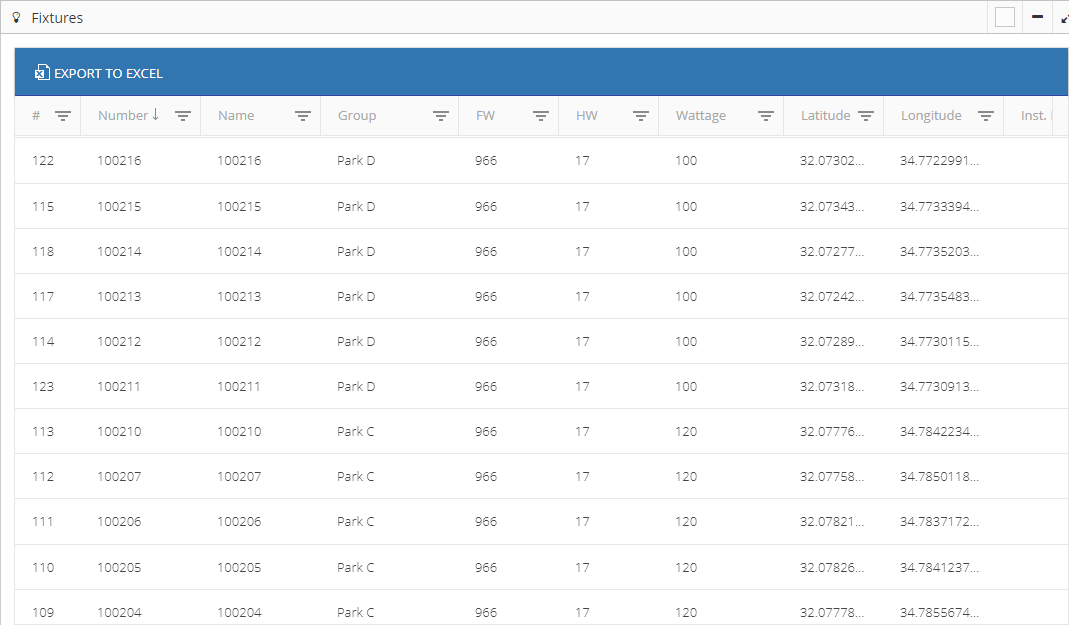
5.3.1 Sorting data
The report data can be sorted by clicking the name of a column.
The data contained in the report can be sorted as follows:
- Ascending, from A to Z (letters) or lower to higher (numbers).
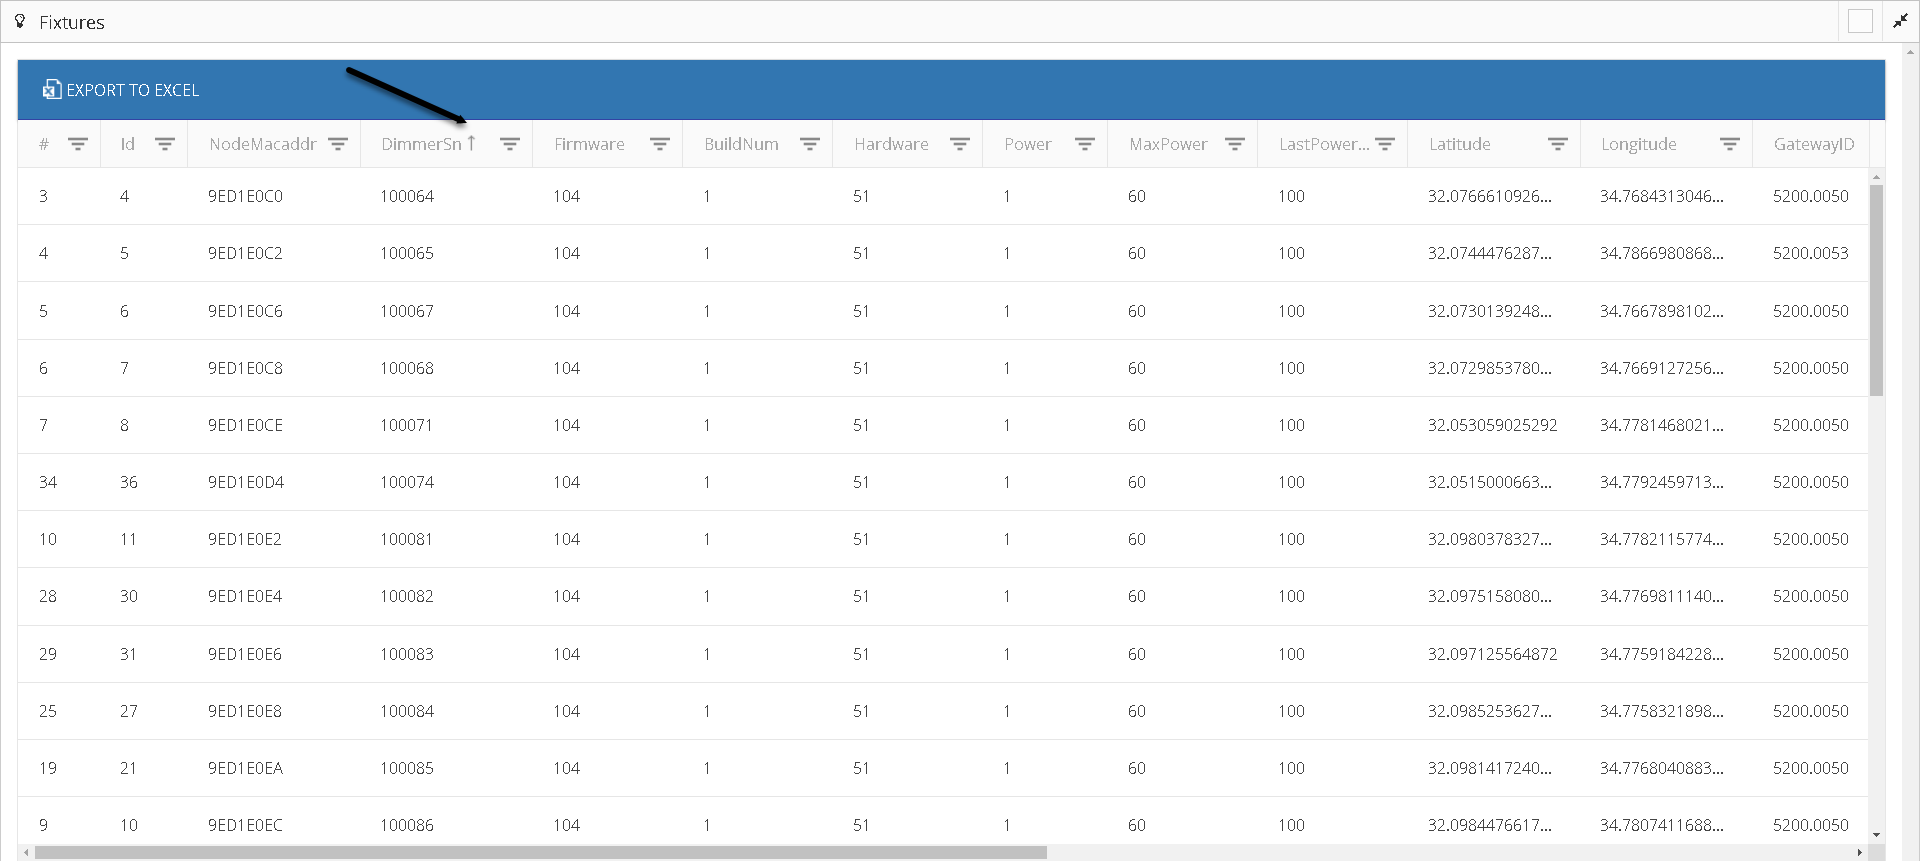
- Descending, from Z to A (letters) or higher to lower (numbers).
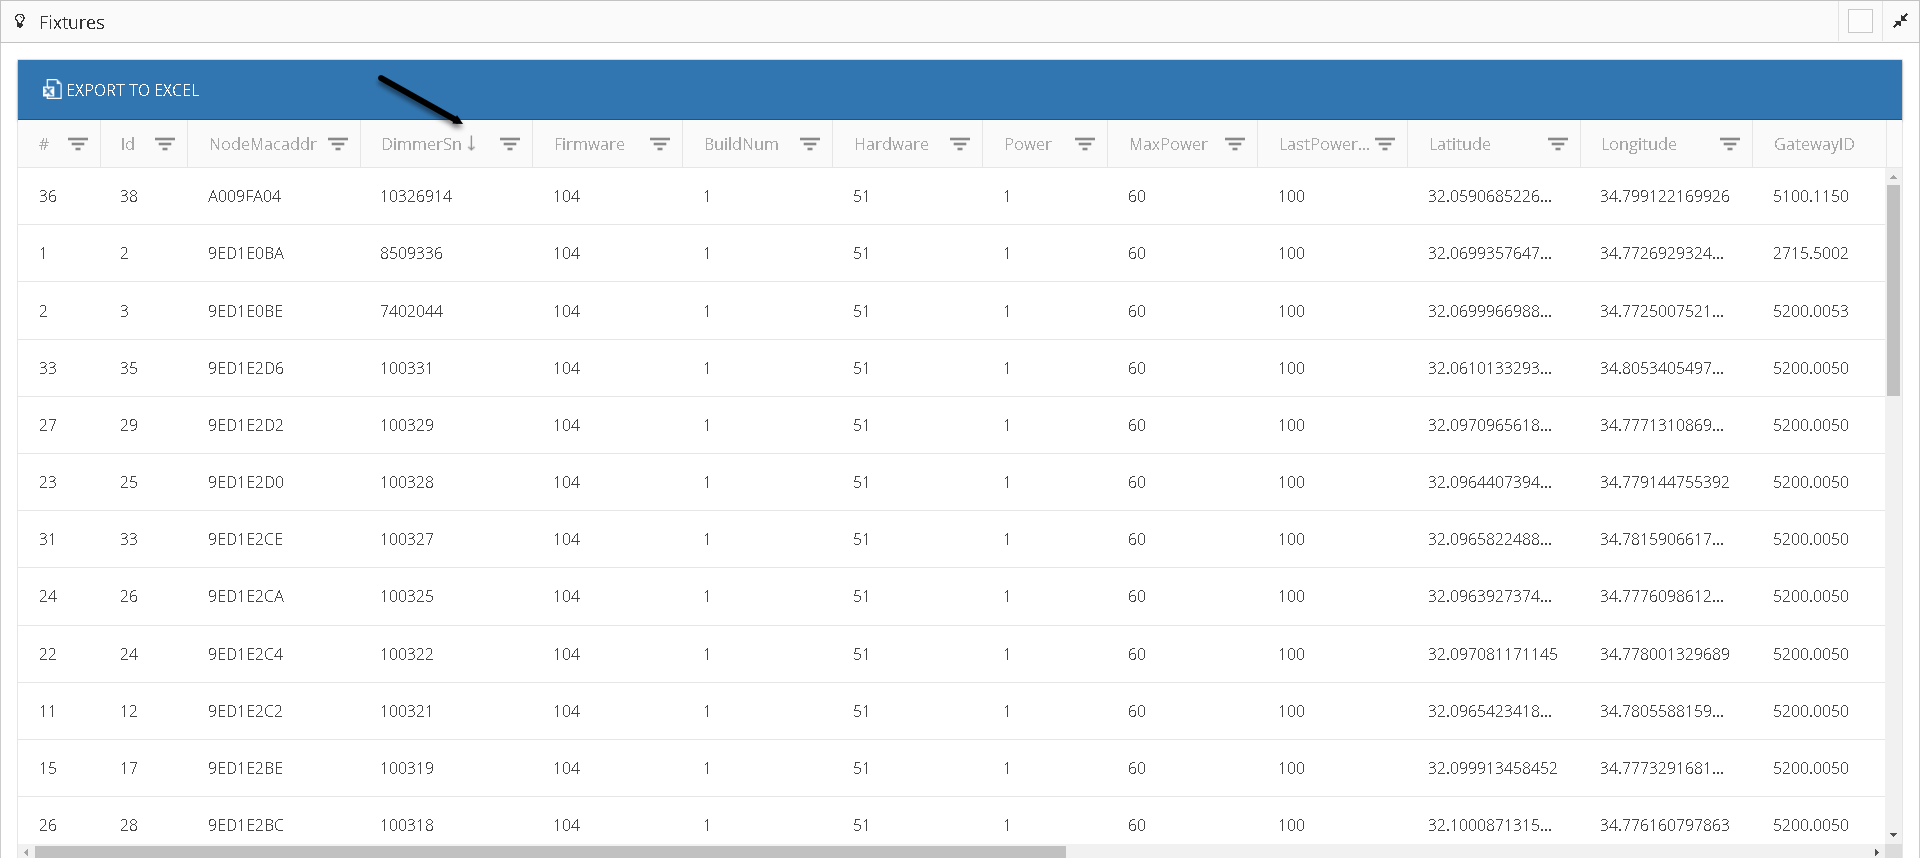
- Default, restores the original order of the generated report.
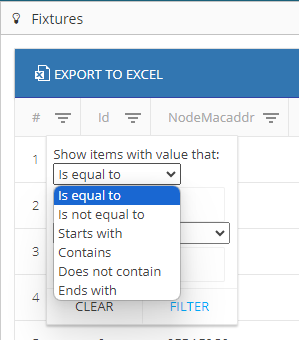
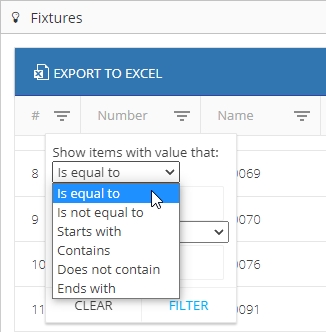
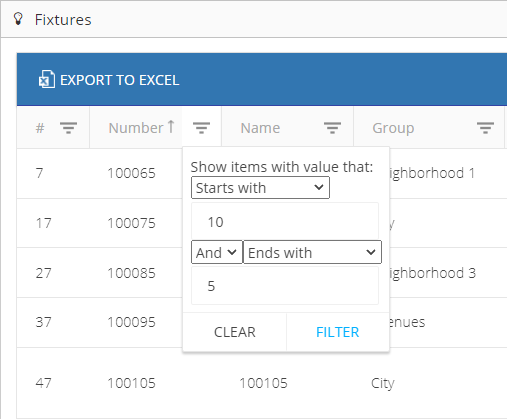
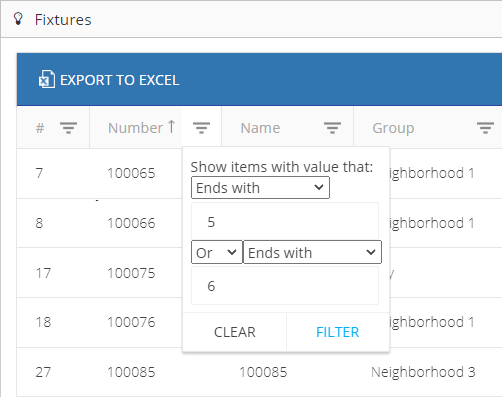
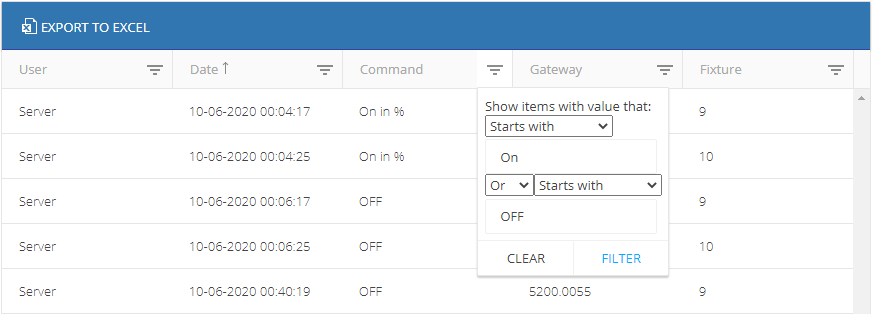
5.3.2 Data filtering
To perform the data filtering, click on the icon next to the name of the column.
The data contained in the report can be filtered as follows:
- Is equal to
- Is not equal to
- Starts with
- Contains
- Does not contain
- Ends with
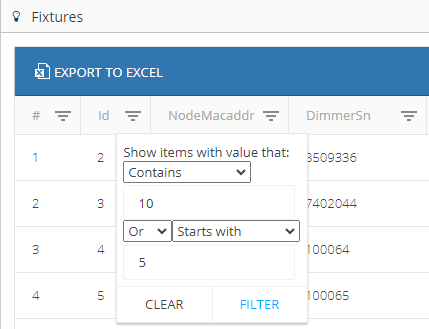
Up to 2 types of data filtering can be defined per column, with the following logical operators:
- And
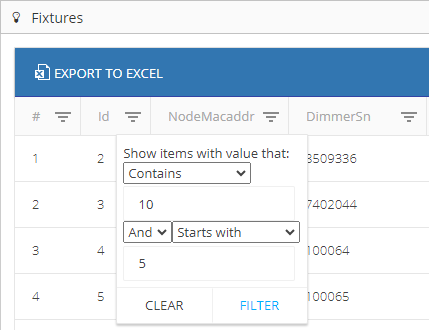
- Or
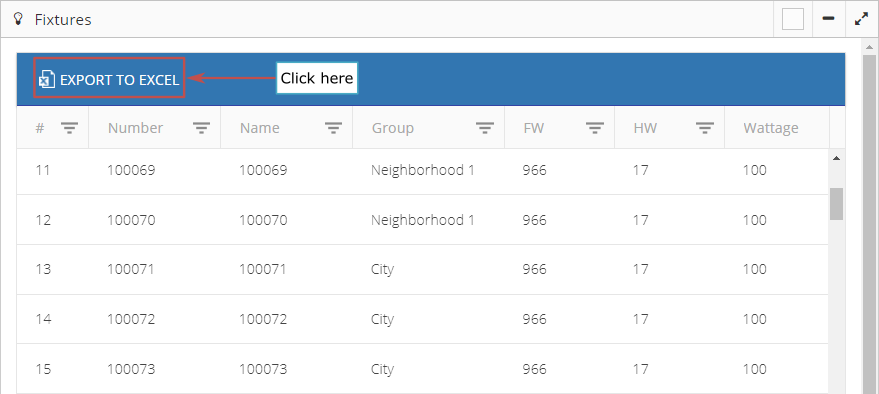
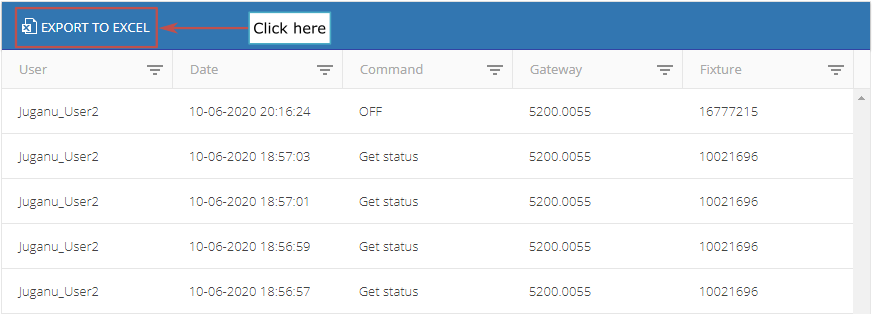
5.3.3 Export to Excel
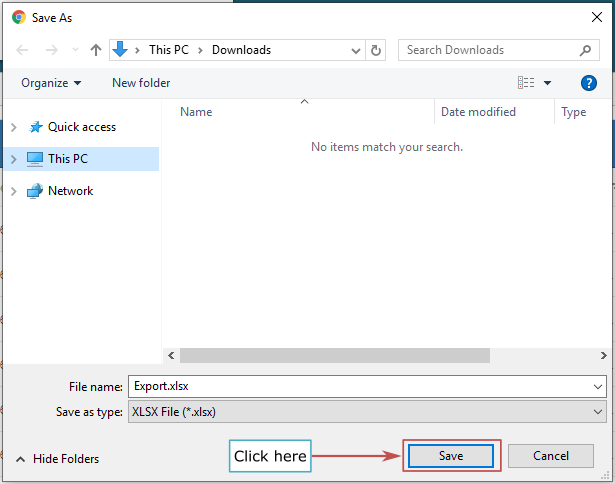
The report can be exported to Excel, and then downloaded to the local machine.
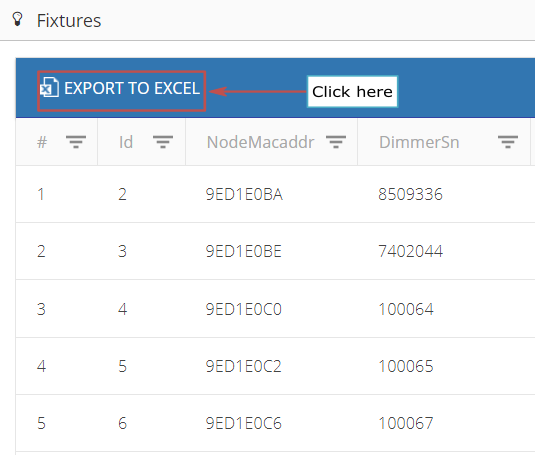
The pop-up window allows to define the name and location of the generated file.
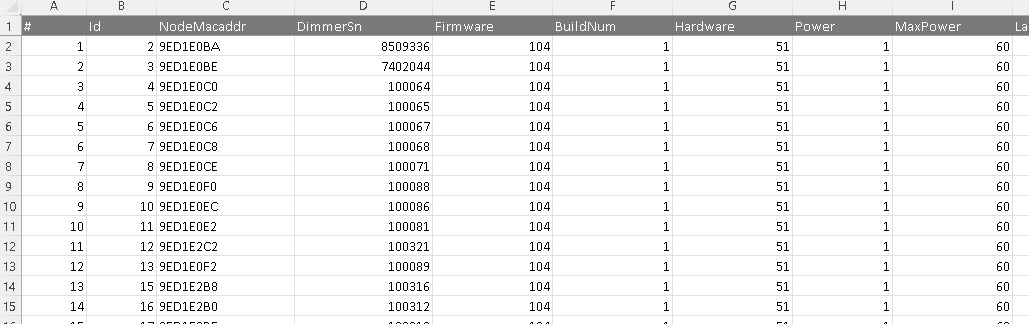
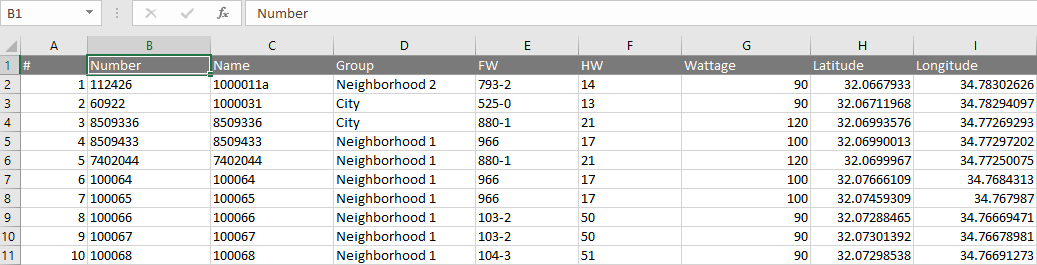
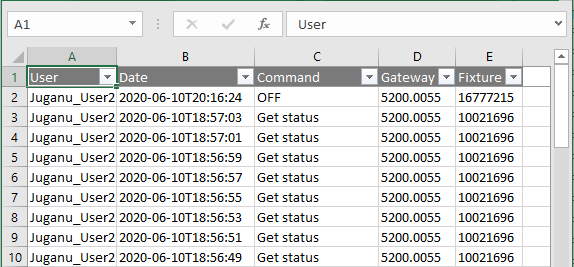
Below is an example of the contents of the exported file.
5.4 Fixture Status
The report shows the status and all the information of the fixtures of a selected group or groups.

5.4.1 Sorting data
The report data can be sorted by clicking the name of a column.
The data contained in the report can be sorted as follows:
- Ascending, from A to Z (letters) or lower to higher (numbers).
- Descending, from Z to A (letters) or higher to lower (numbers).
- Default, restores the original order of the generated report.
5.4.2 Data filtering
To perform the data filtering, click on the icon next to the name of the column.
The data contained in the report can be filtered as follows:
- Is equal to
- Is not equal to
- Starts with
- Contains
- Does not contain
- Ends with
Up to 2 types of data filtering can be defined per column, with the following logical operators:
- And
- Or
5.4.3 Export to Excel
The report can be exported to Excel, and then downloaded to the local machine.
The pop-up window allows to define the name and location of the generated file.
Below is an example of the contents of the exported file.
5.5 Opcodes Log
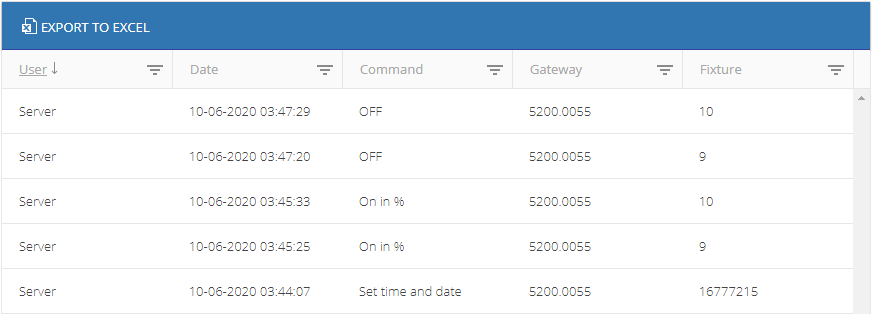
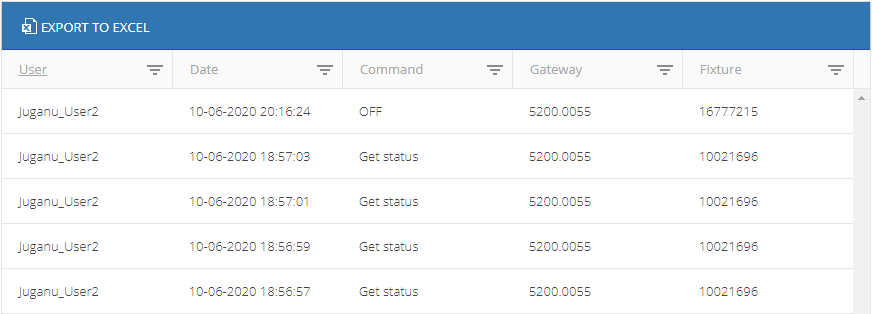
Report that shows the operation codes (Opcodes) sent on the site, for a Group or Groups selected.
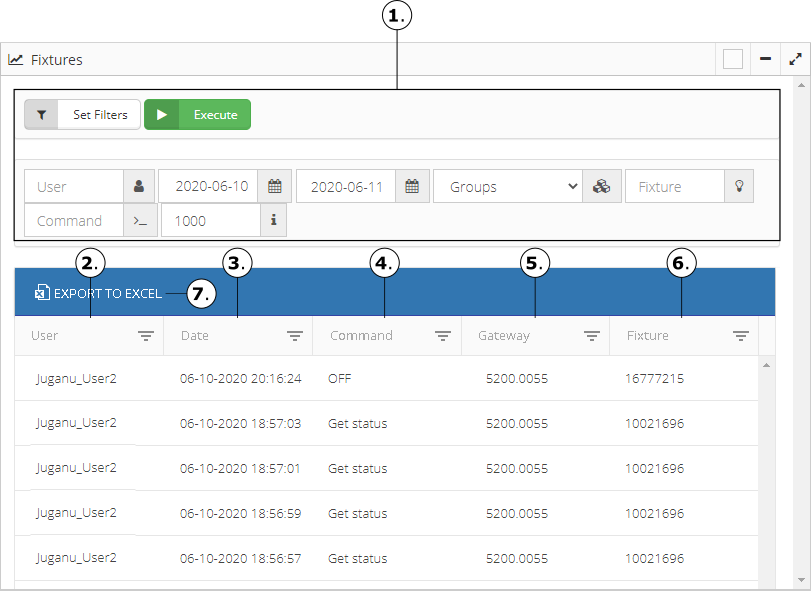
Control area to set the diverse types of filters to perform in the register of the operation codes (opcodes).
Column showing the name of the user who sent the operation code (opcode), for each record shown in the table. The user’s name may be a user registered on the site or the name of some internal process that is executed by the services available on the system.
Column showing the date when the operation code was sent, for each record shown in the table.
Column showing the description of the sent command, for each record shown in the table.
Column showing the ID of the Gateway where the operation code (opcode) was sent, for each record shown in the table.
Column showing the serial number of a fixture or the network address of a Group where the operation code (opcode) was sent, for each record shown in the table.
The Button allows to export the table of Opcodes records, according to the established filters.
5.5.1 Filters Opcodes Log

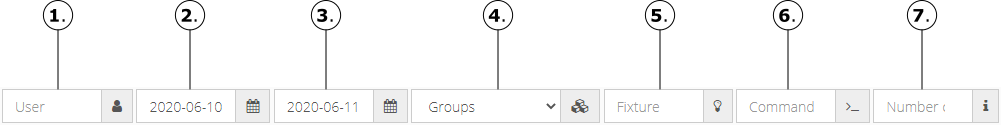
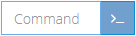
- This filter allows to enter the name of a specific user, to filter Opcodes performed by the user on the site.

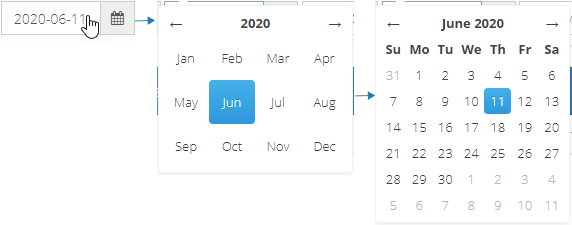
- This filter allows to enter a specific start date, filtering the Opcodes made since that date. The date format is “yyyy-mm-dd”, yyyy (four-digit year); mm (two digits of the month); and dd (two digits of the day).
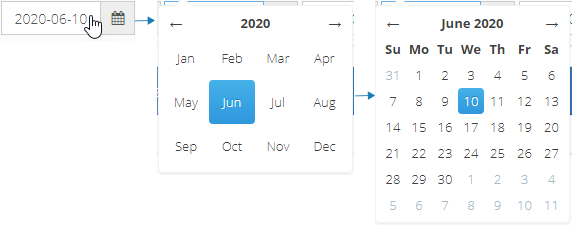
- This filter allows to enter a specific end date, filtering the Opcodes made up to that date. The date format is “yyyy-mm-dd”, yyyy (four-digit year); mm (two digits of the month); and dd (two digits of the day).
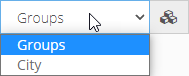
- This filter allows selecting the name of the Group of a list of Groups (subgroups) that the selected Group has.
- This filter allows to enter the serial number of a specific Fixture, to filter the Opcodes made under the serial number entered.

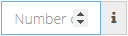
- This filter allows to enter the specific opcode number.
- Shows a limited number of results in the defined search. The limit default for the number of results is 1000.
5.5.2 Sorting data
The report data can be sorted by clicking the name of a column.
The data contained in the report can be sorted as follows:
- Ascending, from A to Z (letters) or lower to higher (numbers).

- Descending, from Z to A (letters) or higher to lower (numbers).
- Default, restores the original order of the generated report.
5.5.3 Data filtering
To perform the data filtering, click on the icon next to the name of the column.
The data contained in the report can be filtered as follows:
- Is equal to
- Is not equal to
- Starts with
- Contains
- Does not contain
- Ends with
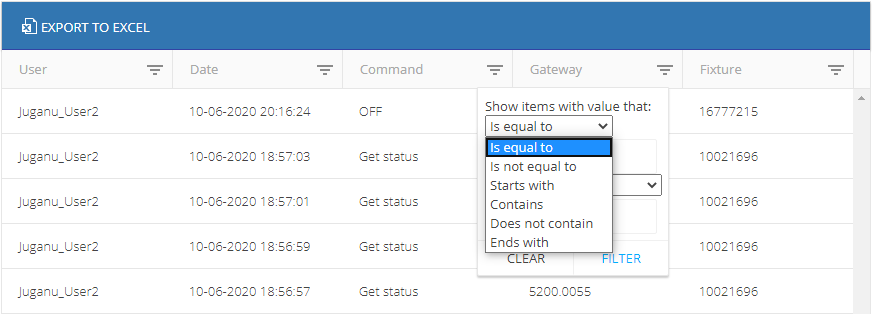
Up to 2 types of data filtering can be defined per column, with the following logical operators:
- And
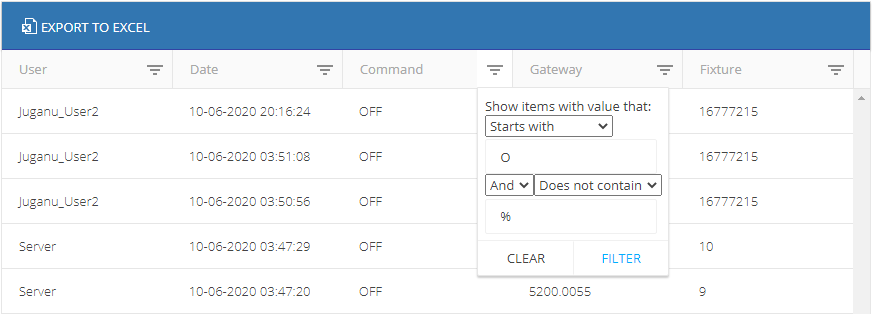
- Or
5.5.4 Export to Excel
The report can be exported to Excel, and then downloaded to the local machine.
The pop-up window allows to define the name and location of the generated file.

Below is an example of the contents of the exported file.
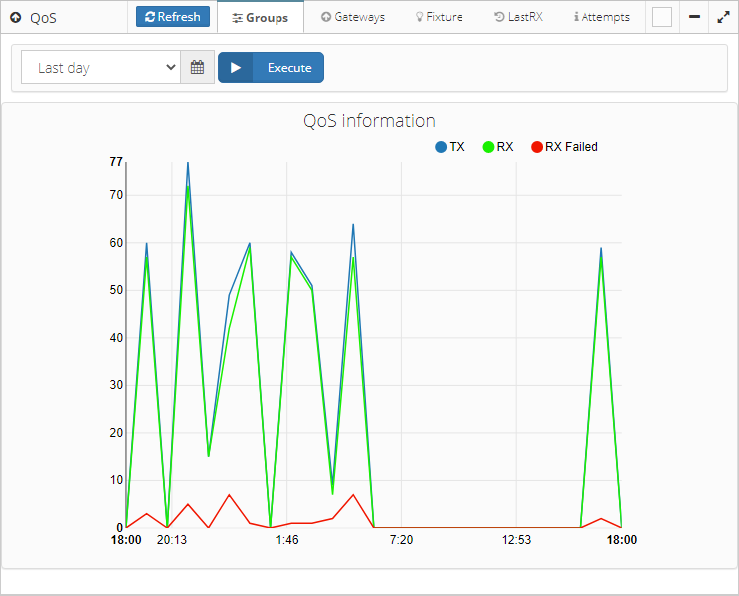
5.6 Quality of service (QoS)
This report shows the QoS of the selected Group or Groups and also allows to select Gateway or Fixture.
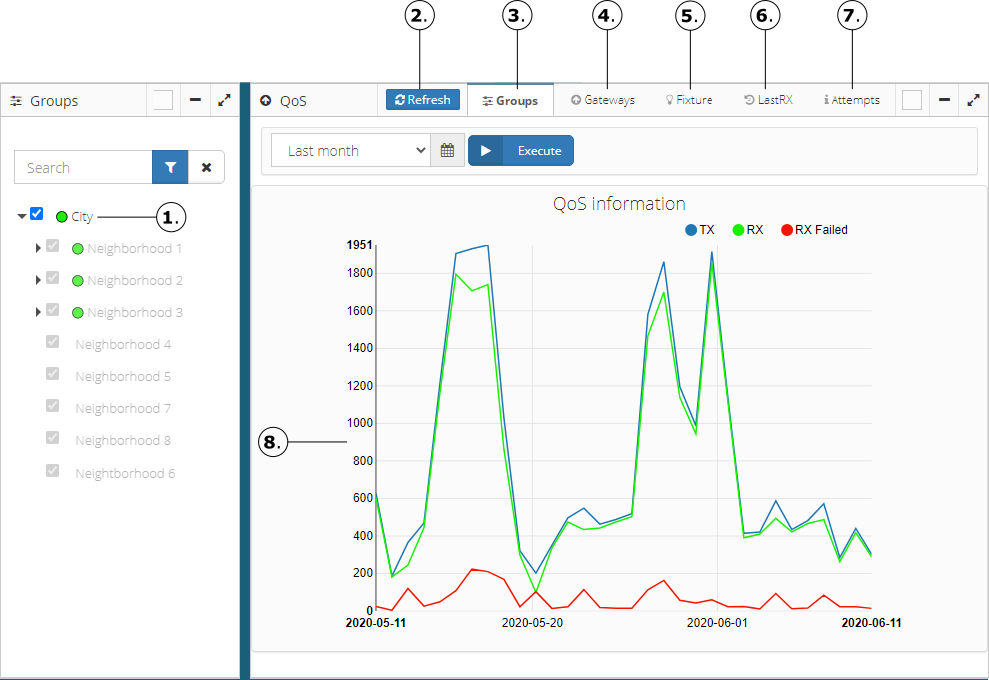
Gateway or Group selection, as required by the report.
The button manually updates the information on the screen.
Group QoS chart tab
Gateway QoS chart tab.
Fixture QoS chart tab.
LastRX chart tab.
Attempts chart tab.
Visual representation of the data TX, RX and RX failed of the criteria applied.
NOTE
Quality of Service (QoS) in fixtures determines the response rate a fixture at the time of sending and receiving commands.
For example, for a fixture that has had 8 responses (Rx) of 10 sent commands (Tx), from the moment it was installed to date, the percentage of Quality of Service would be = (8/10) = 0.8 which is equivalent to 80%.
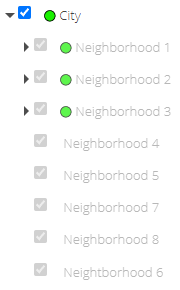
5.6.1 Group QoS Chart
Chart showing a comparison between the TX (sent transactions), RX (received responses) and RX failed (failed responses) values for a selected Group, according to the selected filter.
NOTE
Switching to the Group Tab, the tree view selection will change from Gateway to Group selection mode.
Below is the list of predefined filters:
Last day
Last week
Last month
Three months back
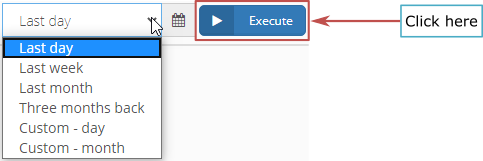
- Custom per day filter, specifying a specific day.

- Custom per month filter, specifying a specific month.

5.6.2 Gateway QoS chart
Chart showing a comparison between the values TX (transactions sent), RX (received responses) and RX failed (failed responses) for a selected Gateway, according to the selected filter.
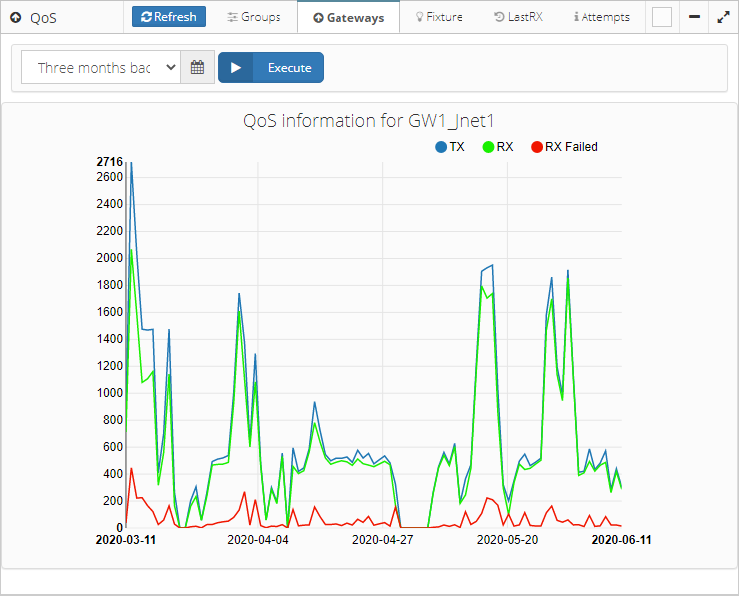
Below is the list of predefined filters:
Last day
Last week
Last month
Three months back
- Custom per day filter, specifying a specific day.
- Custom per month filter, specifying a specific month.
5.6.3 Fixture QoS chart
Chart showing a comparison between the values TX (transactions sent), RX (received responses) and RX failed (failed responses) for a specific Fixture, according to the selected filter.
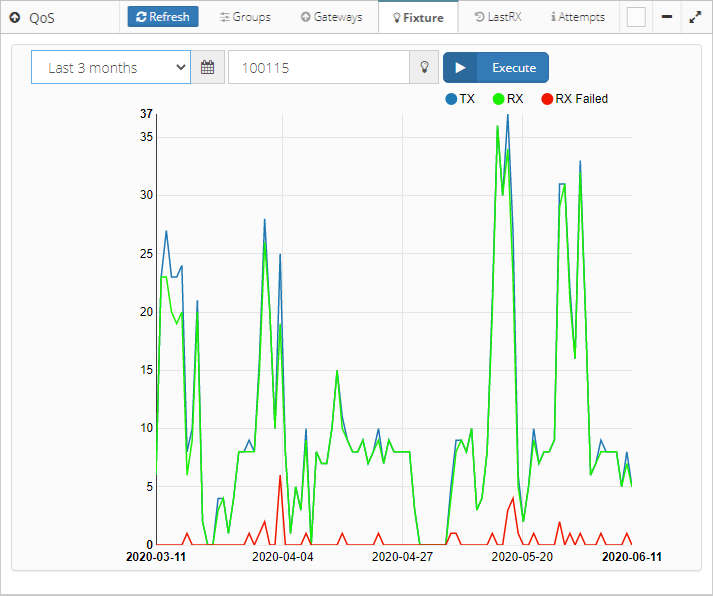
NOTE
To generate the graph, it is mandatory to enter the serial number of the fixture.

Below is the list of predefined filters:
Last day
Last week
Last month
Three months back
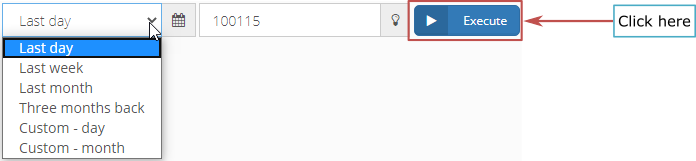
- Custom per day filter, specifying a specific day.

- Custom per month filter, specifying a specific month.

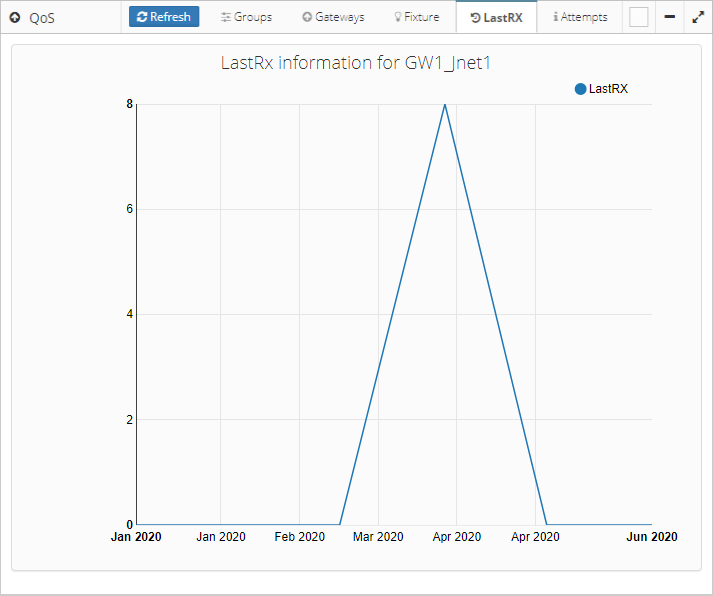
5.6.4 LastRX chart
Chart showing per month the number of fixture that stopped responding (LastRX - last successful response obtained) for the selected Gateway.
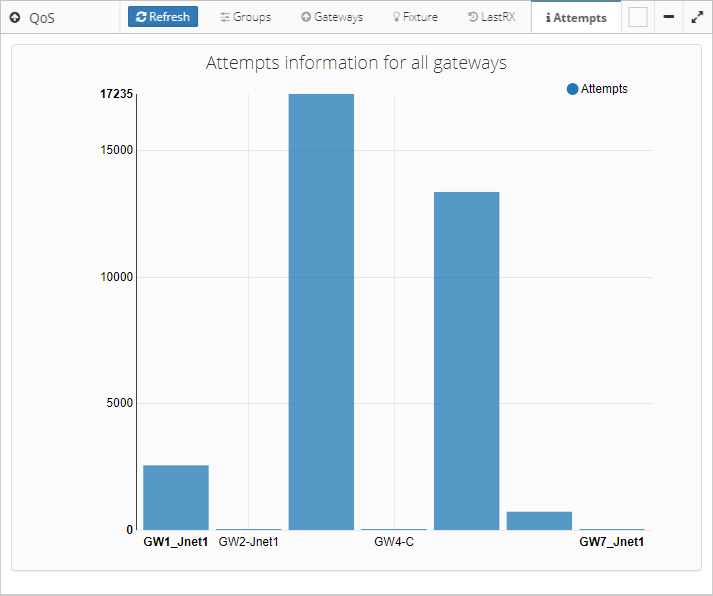
5.6.5 Attempts chart
Chart showing the number of attempts (failed sending commands) for Gateways, assigned to the site. Allows to analyze if there are communication problems in each Gateway.
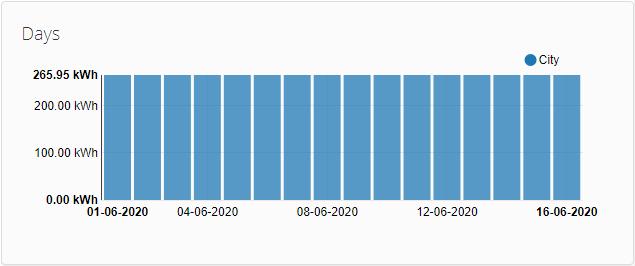
5.7 Operation hours
The report shows the hours operated (of operation) to 100% of the fixtures assigned to the site. As shown in the following picture, the luminaires accumulated a total of 18 hours of operation at 100%. Although they could have been on all day (24 hours) with a lower percentage of attenuation.
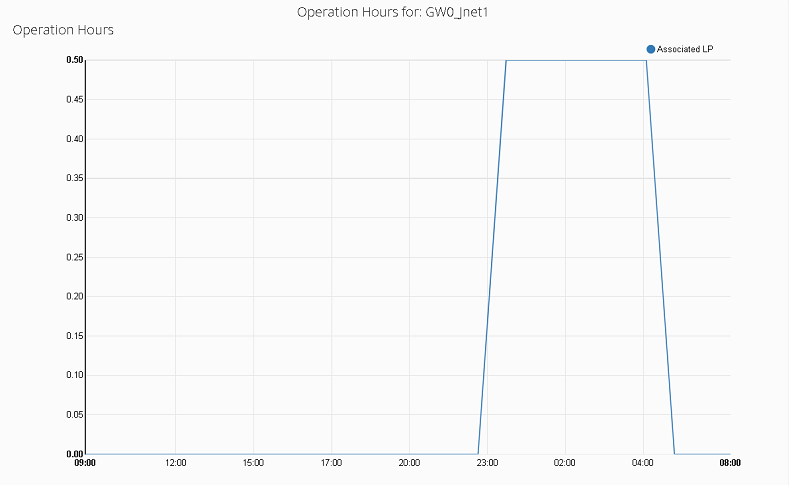
The graphic generated makes a comparison between:
the calculated hours of operation to the light profile associated (Associated LP) with the selected Gateway,
the hours of operations obtained in the monitoring (Read LP) of a certain number of fixtures defined as sampling,
the calculated hours of operation to the light profile initially established (Established LP) with the selected Gateway,
and hours operated previous to Juganu (Legacy LP)
5.7.1 Chart filtering by Gateways
- Filter by Gateway, allows selecting the different groups or Gateways that wants to be viewed.
5.7.2 Chart filtering by Dates
Below is the list of predefined filters:
Last day
Last week
Last month
Last three months
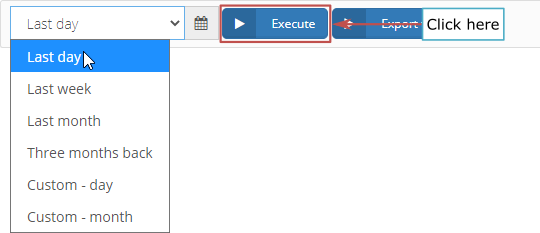
- Custom per day filter, specifying a specific day.

- Custom per month filter, specifying a specific month.

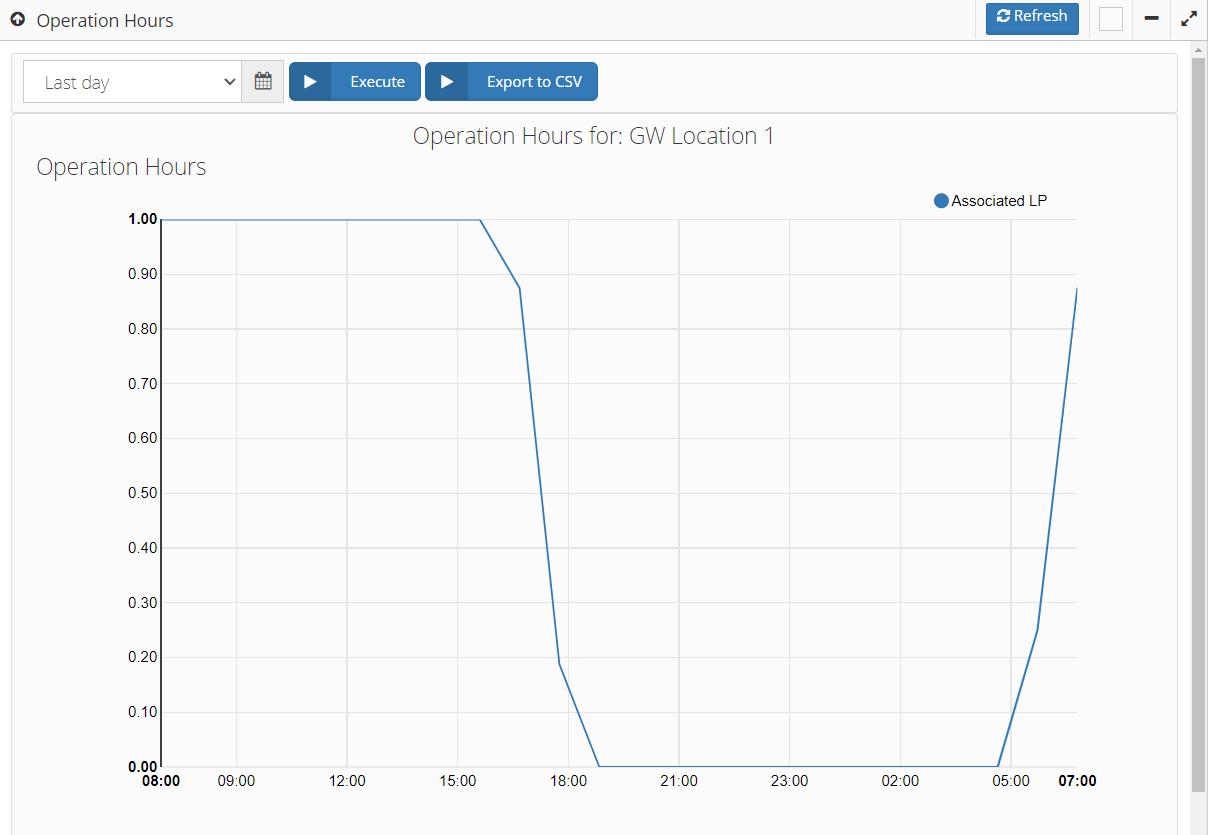
Example of Operation hours chart filtered by Last day
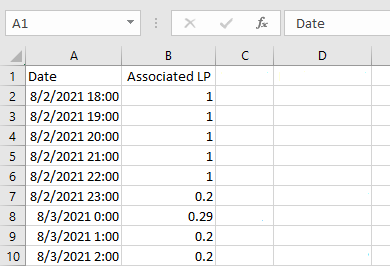
5.7.3 Export to CSV
The values of the graphics can be exported to CSV files (Comma Separated Values), and then downloaded to the local machine.
The pop-up window allows to define the name and location of the generated file.
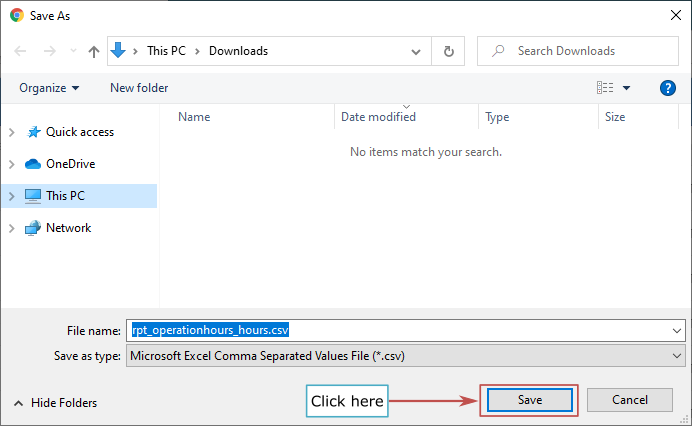
Below is an example of the contents of the exported file: